
Tooltips are often used to help the viewer gain a better understanding of what's displayed. This entry discusses the use of data within tooltips.
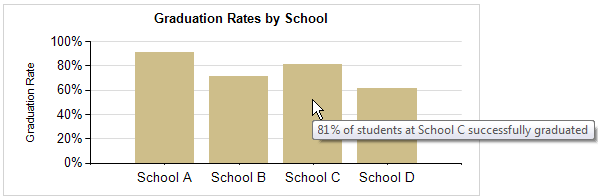
At a glance, the viewer sees the approximate percentage for each school based on the X axis:

In addition to the overall comparison of totals between schools, the exact percentage for each school is also useful information. To keep this chart uncluttered, let's choose to provide the exact percentage using a tooltip.
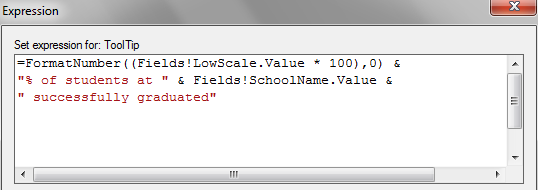
Right-click the chart, select Series Properties, and open the tooltip expression (fx) window. This expression uses the Fields Collection (i.e., the data) as well as text:
The above expression results in the viewer seeing the following:
Regarding the FormatNumber function: My source data is stored as decimal(10,2) which translates perfectly for display on the X axis when the axis is formatted as a percentage. However, that data type doesn't look very nice in a label. To handle this, I first multipled by 100 (which took my .81 to 81.00), then I used the FormatNumber function with 0 decimal places (which took my 81.00 to 81), and finally concatenated the % symbol along with some descriptive text.