
Note: this entry has been updated since its original posting due to new information available.
We are experiencing performance degradation with SQL Server Reporting Services 2008 R2 in SharePoint 2010 Integrated Mode, as compared to Native Mode. Along with my fellow Mariner Derek Sanderson, I’ve spent the last few days working with Microsoft Partner Technical Support to find the root cause and determine if performance can be improved. This entry discusses what we found during the troubleshooting process and, if you are having the same issues, give you some ideas of where to look.
The Executive Summary
For the foreseeable future, we have chosen to revert to Native Mode for our Education Group client implementations. We are reverting because the performance decrease in SP Integrated Mode is unacceptable, for these reasons:
- The bulk of the time spent during report rendering is due to the number of HTTP calls between the Web Front End (WFE) and the Reporting Services servers. This is due to:
- Integrated Mode results in more calls than Native Mode, which results in more overhead.
- Version 10 of Microsoft.ReportViewer.WebForms is slower than Version 9 was.
- Our dashboards are very visual. They contain indicators, sparklines, gauges, and charts which are treated as images by the browser. This means we have a lot of HTTP calls devoted to calling images. Most images appear to be rendered in a single thread, and each HTTP image call experiences some blocking and waiting. Our experience with a visual dashboard is that the images are taking about 90% of the rendering time. Also, since the images are being created dynamically by SSRS, they are given a unique identifier which is not cached - so the end result may be the same image that is already displayed multiple times.
- Microsoft testing has discovered that we are experiencing a performance penalty because charts & gauges are embedded within a tablix. This is due to the new "filling" behavior supported in R2 which means the image rendered in HTML grows to fit the available space. Report Viewer Control 10 handles this "better" than RVC 9 did, which is proving out to be costly.
- This SQLCAT article concludes that, although there’s a 400 millisecond performance penalty expected in SP Integrated Mode, that SP Integrated Mode with SQL Server 2008 R2 ultimately outperforms Native Mode. We found the performance penalty to be far more than a 1/2 second delay in our situation and therefore could not risk performance on existing and future client implementations.
- Microsoft Partner Technical Support concurred our best solution at this time was to revert to Native Mode. After Microsoft reviewed HTTP traces, IIS logs, FREB analysis, SharePoint logs, PerfMon data, Profiler traces, and network analysis, they concluded the bulk of the time is being spent in the Report Viewer control.
- Everyone we spoke with at Microsoft reiterated this is known behavior, and to be expected.
Below are further details, should you choose to dive in.
Background: Our Environment
We recently changed our SQL Server 2008 R2 Reporting Services instance from Native Mode to SharePoint Integrated Mode, for several reasons. Most notably we wanted to use fields within the Reports Library for metadata, and to take advantage of versioning and check out features in SharePoint.
We are using SAN storage in a hosted environment. We are running SharePoint 2010 Foundation (currently on CU3). There are 3 machines in our SharePoint farm: (1) SQL Server (two instances: one which has our relational DBs, the Report Catalog, as well as SSAS; and the other instance for the SP Content databases); (2) a Web Front End; and (3) a Domain Controller. We are running the 64-bit SQL Server Enterprise Edition on Windows Server 2008 R2 Standard. There’s a big backbone in our hosted solution environment, so resources aren’t of primary concern (although they were evaluated during the troubleshooting process – I won’t be speaking to hardware resources in this blog entry).
My SSRS report is set up as a snapshot because the data changes infrequently. Its data source is an Analysis Services cube. There is one group hidden initially, expanded by clicking a toggle. If all collapsed data were expanded, it would be a grand total of 58 rows. There are 3 parameters present, all of which have default values. Within the report, I’m using one tablix which embeds one gauge, one bar chart, two indicators, and a sparkline. It’s a very visual dashboard-like report. What’s shown in the following screen shot represents 4 rows of data:

Our Issue with Slow Performance
After converting to SP integrated mode, we quickly discovered that the same report ran significantly longer within the SharePoint Reports Library we created, as compared to how it ran in Native Mode. In SP Integrated mode, it was taking around 11 seconds for the report to initially render in the browser. When I expanded one toggle, it took 5-7 seconds to display the collapsed data. Basically unacceptable, particularly for such a small set of data (12 rows initially displayed; 58 total rows with the hidden toggles) running off of a snapshot.
On an internal version of the same report I have a parameter which allows the user to expand or collapse all toggle items with one click (instead of needing to click 12 times). This option takes almost 1 full minute to render – ouch! This is extremely unacceptable – although it’s a visual report, there are only 58 rows of snapshot data being rendered. As we’ll see later, the bottleneck is with the images.
Report Catalog Execution Log
I checked the Execution Log using the following query:
USE ReportServer
GO
SELECT *
FROM ExecutionLog2
ORDER BY TimeStart DESC
Side note: The ExecutionLog2 is a view specifically for reporting on SQL Server 2008. It provides several derived fields which decode the meaning of data in the ExecutionLogStorage table.
This query confirmed the trouble wasn’t related to data retrieval. The TimeRendering was about half a second; although this was longer the ~90ms in Native Mode, a half a second is still speedy enough in my book. Following are a few fields from the ExecutionLog2 view, which first shows the initial rendering, then the click of a toggle button to expand some detail.

Report Server URL
To make things more interesting, in addition to running the report via the Report Viewer web part in SharePoint, we ran it directly using the Report Server URL (ex: http://ServerName/ReportServer).
Side note: Although the /Reports web page is inactive in SP Integrated mode, the /ReportServer page is still active.
Rendering the report directly from the /ReportServer URL was significantly faster than rendering it through the Report Viewer web part – comparable to how quickly it ran in Native Mode. This told us that rendering it within the Report Viewer web part added quite a bit to the rendering time.
Cumulative Update 3
As part of our troubleshooting process, we installed CU3. Since our report contains 3 parameters, the Microsoft engineer assigned to our incident encouraged us to install CU3 in the hopes that a fix related to parameter values (KB2276203) would be helpful. Unfortunately, installation of CU3 didn’t help our cause. As of the time I’m writing this, CU5 is available – however, we have no specific reason to install it so we’ve opted not to at this time.
Snapshot versus Caching versus Live
Our intention was to run the report from a snapshot, since the data rarely changes. I also experimented with running the report from a cache. In this situation, the snapshot and the cache provided the exact same performance, from both the Execution Log perspective (just a few milliseconds difference in performance), as well as perception of how quickly the page renders – about 11 seconds.
In our situation, live mode did have greater TimeRendering according to the SSRS execution log – however the overall time rendering didn’t increase. Since our dataset is so small, and is being sourced from a cube, the Processing Options weren’t critical choices for this particular report.
Overhead between SSRS and SharePoint
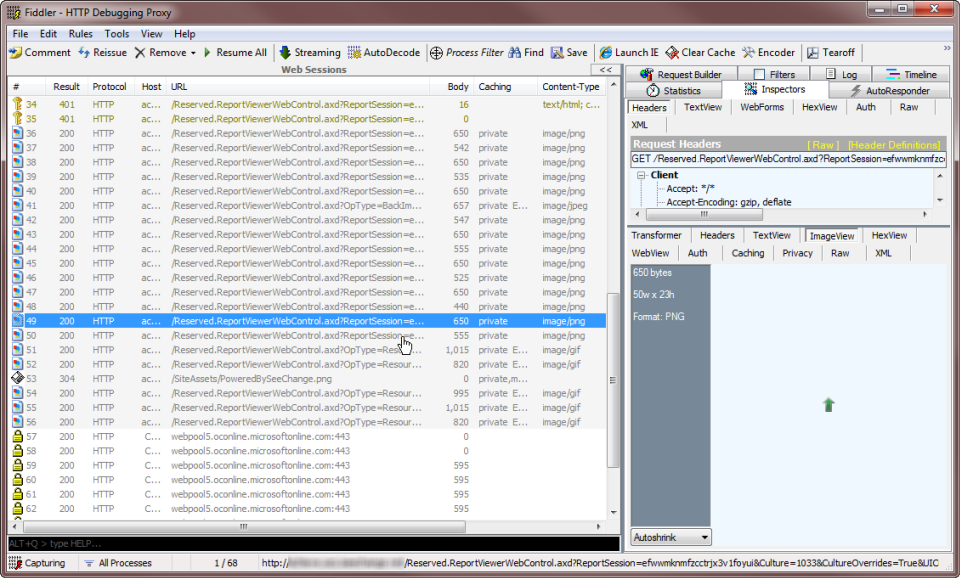
In SP Integrated Mode, there are a lot more WFE API calls, as well as WFE-SSRS API calls. These contribute to the overall rendering time, and is by design according to Microsoft. We discovered this by running traces using both Fiddler2 and Wireshark.
For example: in the screen shot below from Fiddler, see the individual HTTP calls which are devoted to images. In the one that is highlighted, that’s a call to show one of the indicators. In the screen shot above, where I have 4 indicator arrows being shown, that would result in 4 separate calls.
An interesting thing we discovered when comparing traces between running the report via the Report Viewer web part, versus the Report Server URL: there’s no HTTP calls when it communicates with the Report Server. Instead, the calls between the WFE and SSRS are RPC type calls (API calls), or SQL calls for the data. This is to be expected; it just makes comparing the trace files between the two different.
Also, we found that the time for authentication negotiations were handled very quickly in milliseconds, so not of concern.
Image Files Within the Report
According to MSDN: “The Chart, Gauge, and Map data regions behave like images when they are rendered and displayed in the report body.” I would add that the Indicator and Sparkline do as well.
There’s one call per image to be displayed on the report. If the same green up arrow will show in 18 places on the dashboard, then there will be 18 HTTP calls devoted to images.
Using Google Chrome’s Developer Tools gives us another perspective on these image calls. In the following screen shot, you’ll see that of the 11.4 seconds to initially render a report, 8.99 seconds were devoted to the images:

In the next screen shot, I’m hovering on one of the images partway through the process. Note there’s 3.15 seconds blocking and 1.22 seconds waiting:

In this next screen shot, I’m hovering on the last image to be rendered in the process. Note there’s 2.10 seconds blocking and 6.87 seconds waiting:

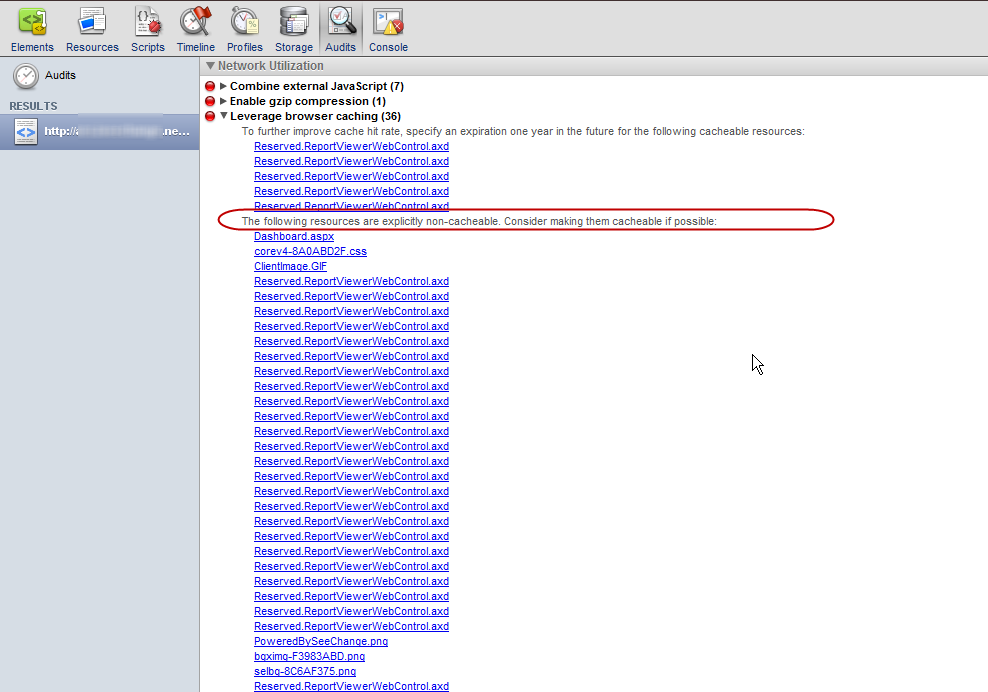
In addition to the above blocking and waiting issues, we discovered the images are non-cacheable. As one of the Microsoft engineers explained it to me, each report element has its own ID, so it can’t be cached. Each image needs to be retrieved using a GET with a status of 200. There aren’t any configurable settings to modify this behavior. The Google Chrome Developer Tools “Audits” pane confirms the images are non-cacheable:
In summary: a number of SSRS data regions are treated as images by the browser, those images are invoked synchronously (ever seen the countdown of items in the left corner of your IE browser?), and aren’t cached.
The HTTP calls are handled differently in Native Mode. In speaking with a Microsoft engineer, his belief was that there’s never any image aggregation in the HTTP calls; however, the following Fiddler screen shot shows what appears to be multiple images in the same call when in Native Mode:

In addition to the items to be displayed on the report, there are HTTP calls devoted to toolbar items (the toolbar icon, the pagination icon, etc). This adds a few more image calls, if the some or all of the toolbar is being displayed to the user.
Optimizing the Report Catalog
The writes to the Report Server Temp DB can become CPU intensive. Another team member did take a look at the I/O activity and if any bottlenecks could be found. A Microsoft engineer reviewed our PerfMon data (incident counters only) and found no signs of I/O latency. SQLCAT has a helpful article about Report Server Catalog Best Practices.
Different Browsers
In our circumstance, I did not see significant performance differences in different browsers. One Microsoft engineer felt that IE 8 would perform much better than earlier IE versions because the default connection limit has been increased from two connections per host to six connections. For me personally, Firefox and Google Chrome both performed the same as IE 7.
Report Viewer
Version 10 of Microsoft.ReportViewer.WebForms renders in AJAX, whereas Version 9 rendered in an IFRAME. My trusty coworker, Derek, attempted to use V9 Report Viewer in our environment. However, V9 is not compatible with the new elements of SQL Server 2008 R2 (on our dashboard, most notably this was the indicator and the sparkline). After mentioning this test to Microsoft, they strongly encouraged us to stick with Version 10 within the SharePoint 2010 / 2008 R2 environment rather than try to revert to Version 9.
Possible Mitigation for the Integrated Mode Performance Issues
What to do, what to do? If the additional overhead is to be expected, what to do? The following are the options we considered (in no particular order). Perhaps one of these options may work for you, if you’re in the same situation.
- Install SQL Server on the same box as the WFE. Only Reporting Services would be installed (and probably result in an extra SQL Server license, although I didn’t look into it). The SQL Server database engine would remain as is, on a separate box. This option wouldn’t reduce the number of API calls, but could avoid some network delays. This is not the recommended configuration, but is an option presented by our support engineer. We did not choose to pursue this option, but it was suggested by a Microsoft engineer as an option.
- Make some report modifications so less images are utilized on the page. Redesigning various reports was not an option for us.
- Stay put in Integrated Mode & be patient. (Perhaps a quick game of Pac-Man?)
- Return to Native Mode. With V10 of the Report Viewer it'll still be slower than V9 was, but Native Mode does consistently render a bit quicker in our environment than Integrated Mode does.
- If you have the Enterprise version of SharePoint, you could render the SSRS report through a PPS web part instead of the Report Viewer. I haven't done this as of yet, but a couple of people on the Microsoft forums have indicated they have gotten better performance this way.
- Avoid embedding gauges & charts within the tablix where possible. Wrapping a rectangle around each gauge or chart does help.
- Try delivering the SSRS report inside of a PerformancePoint dashboard.
So as it stands now, we’re going back to Native Mode, with some disappointment that we can’t take advantage of some of the SharePoint Integrated Mode features until something changes with the product. I will keep my fingers crossed on that front.
Finding More Information
SQLCAT Article: Reporting Services Performance in SharePoint Integrated Mode in SQL Server R2 (Our experience is that the performance penalty is more than an additional 1/2 second as stated in the resolution of this article.)
MSDN Article: Troubleshooting Reports: Report Performance
MS Support Article: General overhead performance differences when you view reports in SharePoint integrated mode versus SharePoint native mode
MS Connect Bug: SSRS 2008 R2 and SharePoint 2010 Performance Issues
MS Forum: SSRS 2008 R2 Add-In Performance Issues
Network Steve Forum: Performance Issue with Images in SSRS 2008 R2 in SharePoint 2010 Integration
MSDN Article: Rendering Data Regions
SQLCAT Article: Report Server Catalog Best Practices
Derek Sanderson's Blog: The Switch Back to SSRS Native Mode for Performance Reasons
Here’s the latest information available from Microsoft on our issue described above. A direct quote from our Sr. Support Escalation Engineer:
The product group did come back as to why the performance was bad with RVC 10. Basically, when we have a chart/gauge/map control in the tablix cell, in 2008 R2 we started supported filling, meaning the image rendered to HTML grows to fit the available space. This calculation is apparently pretty costly that is causing performance hit.
Apparently RVC 9 does not handle this properly (hence not render the report properly) and the performance looks faster because it is not completely doing the job. Currently, I am trying to work with product team to see if there is any way we can avoid the fill calculation since it is proving to be costly.
So, because we have charts & gauges embedded within tablix cells, this results in performance issues. Because a table and list are both tablix data regions, that type of redesign isn’t an option. As of now, Microsoft is still looking into a workaround for us.