
***Note this post applies to Power BI for Office 365 (deprecated as of 12/31/2015). Though some concepts remain the same or similar, all details are not necessarily applicable to the new Power BI V2 service.***
A Power BI site in SharePoint Online is basically analogous to a Power Pivot Gallery in SharePoint, but there are some key differences that I will cover here in this post. Note this is being written in May 2014 and these differences will change and evolve.
In this blog entry, when I refer to SharePoint BI I mean the on-premises traditional type of environment rather than SharePoint Online.
Environment

Power BI is a hybrid solution which is partially implemented on-premises and partially in the cloud via Office 365. It requires Office ProPlus (via O365) or Office Professional Plus. You'll want to use O365 ProPlus when possible. It's the newer Click-to-Run (streamable) type of installation which delivers new functionality as soon as it's available (such as Synonyms which are currently only available with the O365 ProPlus type of Office). If you're still on Office 2010, it does work just without new 2013 features (and there's a lot of important ones actually). To take advantage of all Power BI features beyond what is available in Office (such as scheduled data refresh, Q&A, the mobile app, and enterprise search), an Office 365 license and a Power BI license are also required. Also, be aware that with Office 365, computers need to be on the newest operating systems and the newest browsers - this permits Office 365 to provide consistent and predictable product support.

SharePoint BI is usually an on-premises solution (although you could create an Azure VM and run it up there). It requires SharePoint 2013 or 2010. To take advantage of all BI features, the Enterprise versions of SharePoint and SQL Server are required.
Content Viewing

Multiple Document Libraries in the Power BI Site
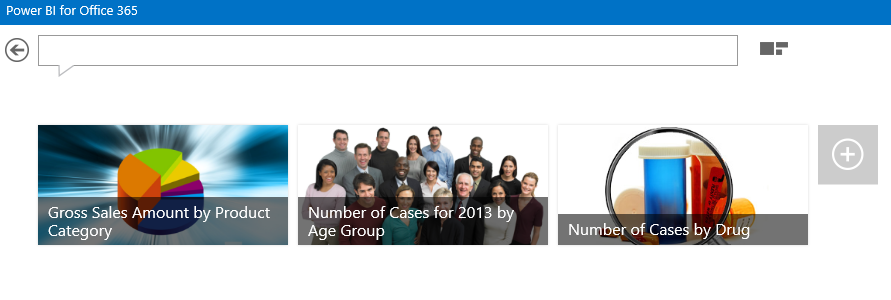
Power BI has a very cool feature which displays all document libraries which exist in the Power BI Site. Although I'd love for this to be a preference whether or not a document library is shown in the Power BI site, I really like this feature because it offers additional flexibility to organize and secure content.
In SharePoint BI, the Power Pivot Gallery is a single document library.
Workbook as a Data Source
Currently, this is probably the biggest, most important, differences between Power BI and SharePoint BI. In SharePoint, we can upload a Power Pivot model to the Power Pivot Gallery and other reports can connect to it using a URL-based connection string. This works for Power View for SharePoint, Reporting Services, PerformancePoint, and Excel. This is a great feature because it separates out the data model from the report(s) if desired - hence the term "workbook as a data source."
However, in Power BI the data model and the reports (created with Excel pivot tables + charts, or Power View for Excel) everything must be contained within a single xlsx file. There's not currently a concept of separating out the data model from the reports, but I sincerely hope that's something the Power BI team can give us. I'm sure there's countless technical challenges to make this happen! The person responsible for the data model isn't always the same person creating the reports, so it would be nice to be able to separate them. More than a handful of reports gets a bit unwieldy in a single Excel file. Doing a "Save As" operation creates duplicate copies of the data which isn't an ideal solution.
Enterprise Search
The Search functionality in Power Query is one of my favorite Power BI features, one that has no equivalent in SharePoint BI at this time. Enterprise Search is the ability to use Power Query to search for corporate data (or public data) which has been exposed by other users sharing Power Queries, or by the administrator exposing an OData feed.
Max Workbook Size
In Power BI, the maximum workbook size currently is 250MB. Nearly all of the data needs to be in the Power Pivot model because only 10MB is permitted outside of the model. That's because within the model it can be compressed and take advantage of the xVelocity engine. (For this reason, make sure to import your data to Power Pivot and not to the worksheet!)
In SharePoint BI, the maximum workbook size is 2GB.
Mobile Application

Power BI Mobile App
Currently only Power BI offers the mobile app which is available for Windows 8.1 devices - iPad support due out by the fall. This is due to Microsoft's cloud-first strategy.
Use of Silverlight
Power BI still uses Silverlight primarily, with HTML5 rendering of Power BI in public preview. You can get to the HTML5 option via an icon at the lower right - this is the best option for iPad mobile access until the native application is available soon.
SharePoint BI still utilizes Silverlight. As does the Office application.
Q&A Natural Language
Currently only Power BI offers Q&A. This is due to Microsoft's cloud-first strategy. At first I wasn't terribly enamored by Q&A, but now I realize it's a great way to visualize data on the fly - which means not every single permeation of a report needs to be pre-defined. If used effectively, this has potential to reduce the volume of reports that are extremely similar to each other.
Data Refresh Options
There are more options to control data refresh in SharePoint BI. In SharePoint there are 3 different ways you can approach handling data refresh.
In Power BI, the options are simpler for the end user but there are some things the administrator needs to know about it.
Data Management Gateway
SharePoint BI has no notion of a Data Management Gateway (DMG), whereas Power BI does since it's a hybrid type of environment partially on-premises and partially cloud-based.
As part of the Power BI DMG and data source options, Power BI also offers the ability to easily expose tables and views as OData feeds for users to consume. This can serve as a 'friendlier' way for users to access data.
Security
With Power BI, you can sign in with an Organization ID (which can be validated against Active Directory), or you can sign in with a Microsoft account.
Typically with SharePoint BI, Kerberos is required and the login is integrated with Active Directory. (By the way, if you've not checked out the whitepaper on Microsoft BI Authentication, it's full of great info applicable to SharePoint BI.)
Management Dashboard
The Power Pivot Gallery in SharePoint has a pre-defined Power Pivot Management Dashboard. Currently, there's not equivalent functionality in Power BI to give the administrator an overall system view of query activity and data refresh activity. But I have my fingers and toes crossed this functionality is coming to Power BI soon.
SSAS Optimization
In Power BI, as soon as a Power-BI enabled workbook (i.e., it contains a data model) is uploaded it is optimized by the system.
In SharePoint BI, there are lengths of time defined to control how long a workbook remains in memory before it's sent to the cache, as well as how long it remains in cache before it's cleared from the cache.
Power View Export to PowerPoint
Power View for SharePoint is available in SharePoint BI when Reporting Services is configured in SharePoint Mode. Generally there's not feature differences between Power View for SharePoint and Power View for Excel - but there is one notable difference. Power View for SharePoint can export a copy of the report to PowerPoint, whereas Power View for Excel does not have this feature.
Power View Access to Multidimensional SSAS Models
As of SQL Server 2012 SP1 CU4, Power View for SharePoint supports the ability to access Analysis Services Multidimensional Models as a data source.
Currently, Power View for Excel cannot access Multidimensional models (it can access an Analysis Services Tabular Model though).
How To Choose?
As you can see, the choice for which type of environment is best for your implementation depends on lots of things. The classic "it depends." A bit of planning is the best course of action to make the best decision for your needs.
If you can think of any other pertinent differences, please leave me a comment - I'd be happy to add it.