Connecting to Analysis Services From Power BI Website, Power BI Designer, and Excel (Part 4)

***Note this post applies to the SSAS Connector which has been deprecated as of mid-2016. Refer instead to the Power BI Enterprise Gateway.***

Welcome to part 4 of a 4-part series on using the SSAS Connector with the new Power BI Preview. This information is as of early June 2015 and will definitely change as the Power BI Preview evolves.

Part I:   Overview of Using Analysis Services Data in the new Power BI Preview

Part II:  What You Need to Set Up the SSAS Connector in the new Power BI Preview

Part III: Monitoring the SSAS Connector in the Power BI Preview

Part IV:  Connecting to Analysis Services From Power BI Website, Power BI Designer, and Excel (you are here)

Comparison of Connectivity Options

Power BI Website: A live query connection to the SSAS Tabular Model which sends DAX statements to the SSAS server for processing. Though it's considered a live connection, to improve performance the data is cached in the Power BI service; this cache is currently refreshed every 10 minutes. Therefore, I tend to think of this as a "near real time" connection. Ideally the 10-minute interval becomes a configurable option at some point because many SSAS models are refreshed less frequently, such as once per day.

Power BI Designer:  Update 7/25/2015 A live connection is now available in the Power BI Designer and works as described in the previous paragraph. This requires installation of the newest version of Power BI Designer.

A live connection, like discussed in the previous paragraph, is not yet available in the Power BI Designer. Currently this operates as a data connection where you bring data in via Query to store in the Model. In all likelihood storing in the Model will become a choice rather than a mandate as the product evolves incrementally.

Excel: Depending on how you connect, you can set up a live query connection or bring the data into the Excel Data Model (Power Pivot). Setting up a direct connection is how we have queried SSAS servers for many years now - it keeps the data centralized in one place. The newer alternative is to replicate the data in the Excel Data Model which can be useful if you need to marry up the existing SSAS data with other data not available in the SSAS database and/or need to define new calculations and such.

Connecting to SSAS from the Power BI Website

The interface to connect to an SSAS server from inside the website is very straightforward, but it does require the SSAS Connector to be set up and running already for it to be discoverable. See the previous parts of this SSAS series for more details on setting it up.

Start with the Get Data menu:


Select the SQL Server Analysis Services option then Connect.

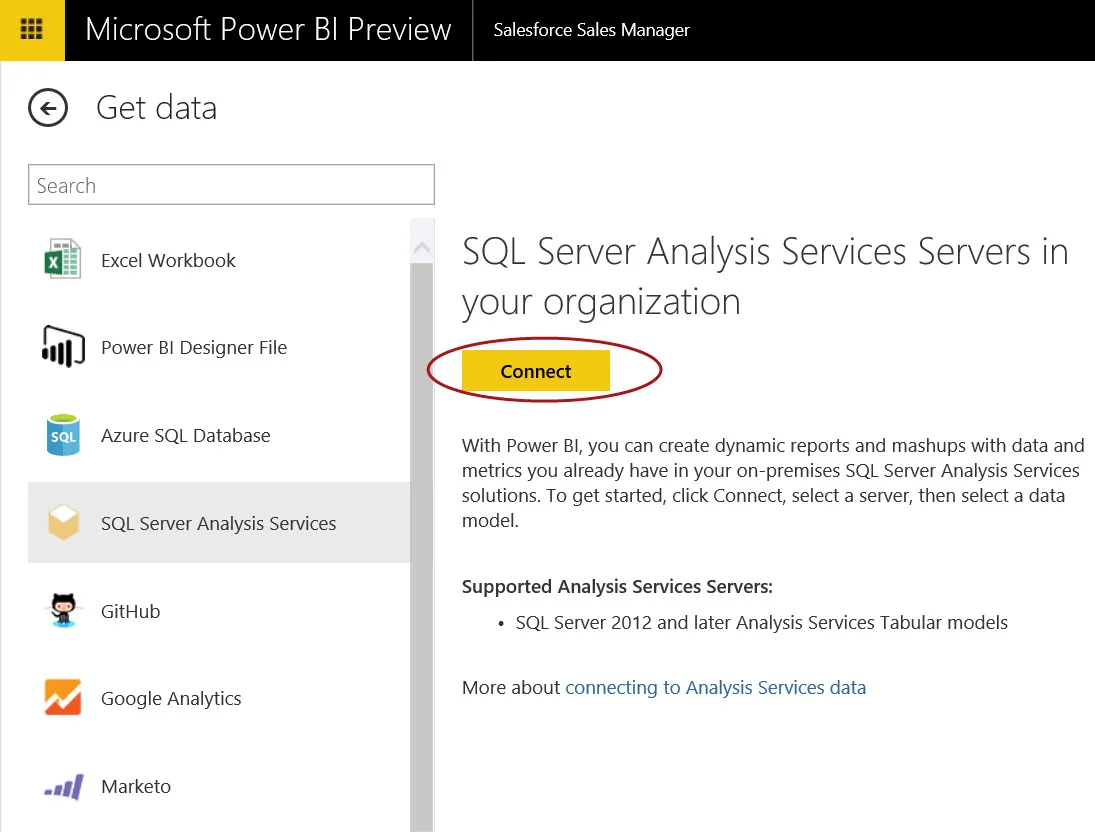
At this point what you will see are all SSAS servers that have been registered in the organization, regardless if you have permission to it. If you try to choose a server that you don't have rights to via a Role, it'll fail to connect at that point.


In my case I only have one SSAS server registered:

Once you have clicked on the server itself, it'll display the name of your SSAS Tabular model. Then you can Connect:

After it's connected, you'll have a new item listed in your Datasets area. It'll have an asterisk next to it to highlight that it's new. Note that if you go through the same process multiple times you'll get duplicate datasets listed (I'm guessing that is a temporary issue). It's a bit hard to see, but my last two Datasets are now duplicates of the same connection:


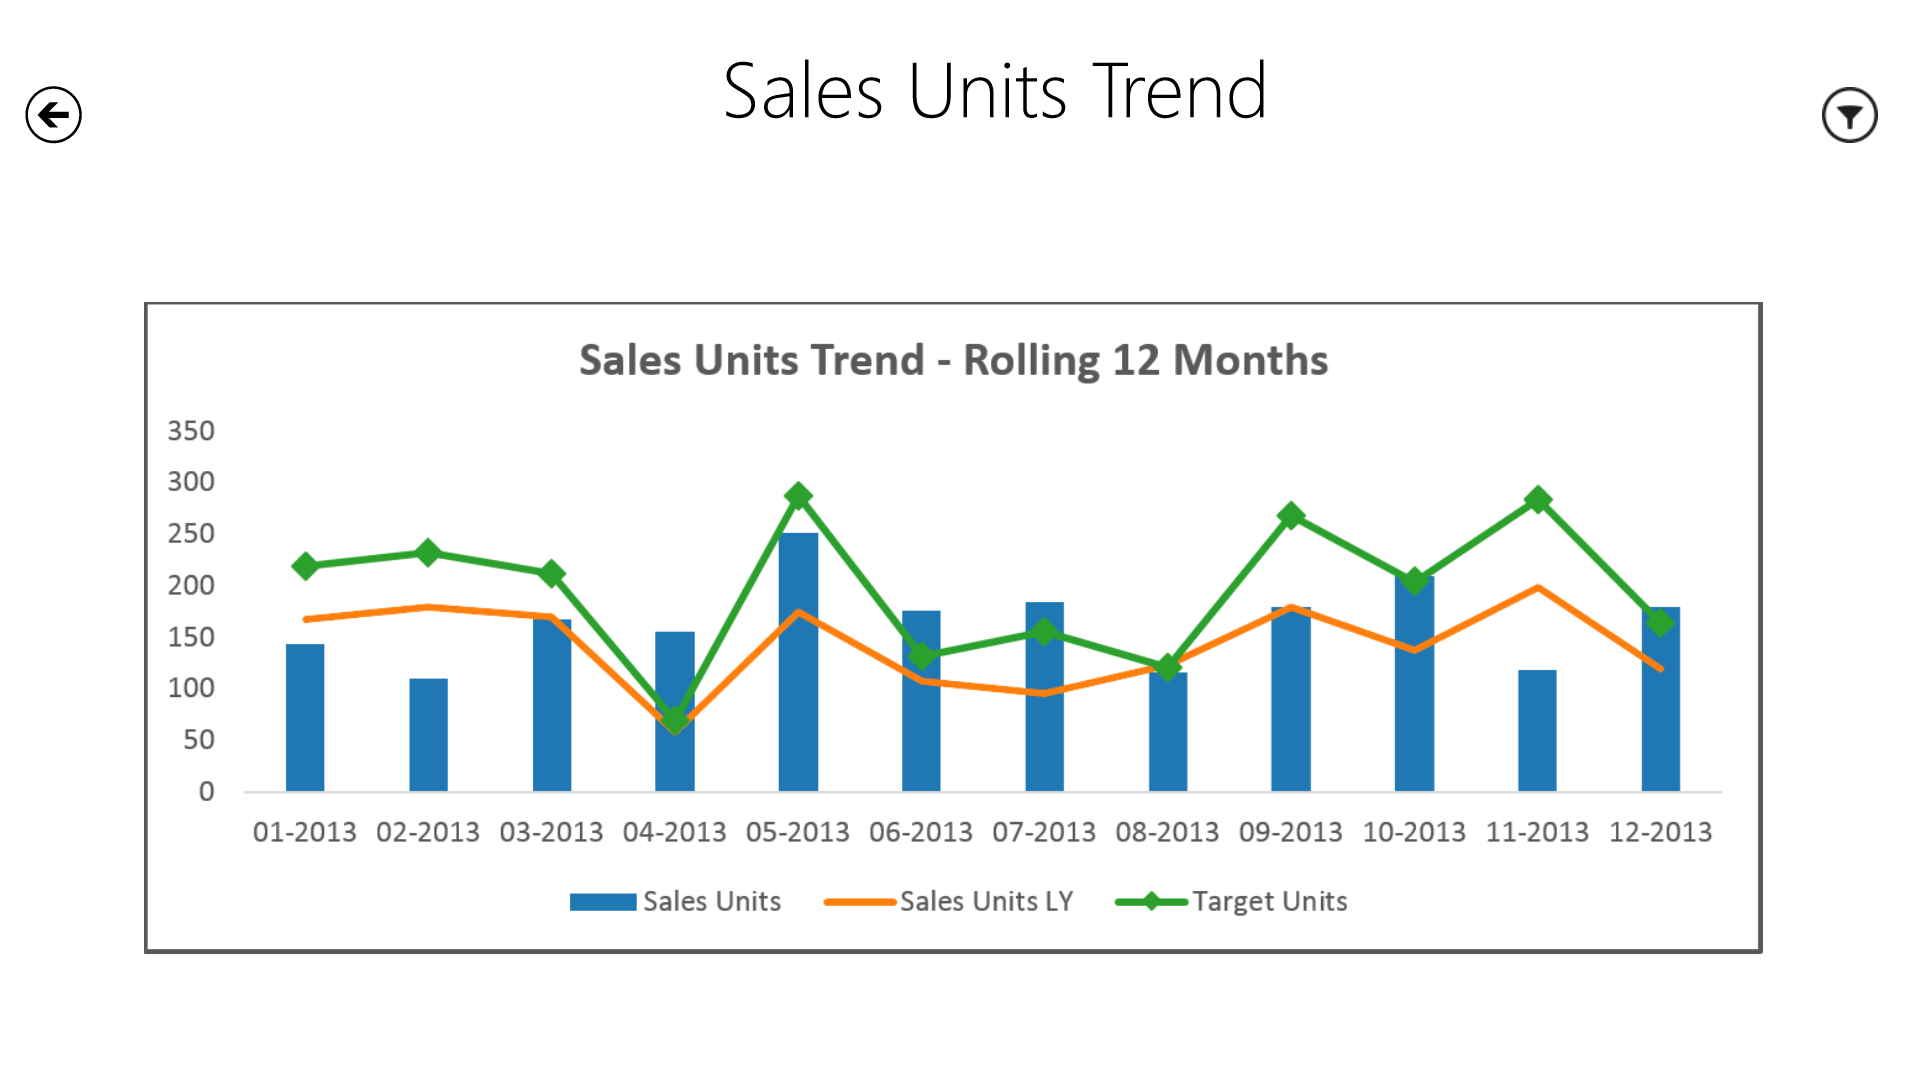
At this point if I click on the Dataset name, it opens a new report connected to my model. The field list is on the right that I can start working with to build out the report:

At this point since Excel Services and Reporting Services report types aren't available yet, this report is a Power View report (my suspicion is the Power View will remain the default report type but that's a guess of course).

Note the context of the 'current dashboard' is being displayed in the breadcrumb at the top of my screen (that's the Salesforce Sales Manager dashboard in my screen shot above). That is where a report item will go if you pin it while working inside of your report. If you want to pin a report item to a different dashboard (and in my case I would), you'll want to go back to the main menu, choose the dashboard, then return to your report. Then the context will be changed. Don't forget you can pin items to a dashboard from a variety of reports. And, a report item can be pinned to multiple dashboards.


Connecting to SSAS from Power BI Designer

Since the direct connection isn't available yet, the interface for searching for registered SSAS servers isn't currently the same in Power BI Designer as it is in the website.

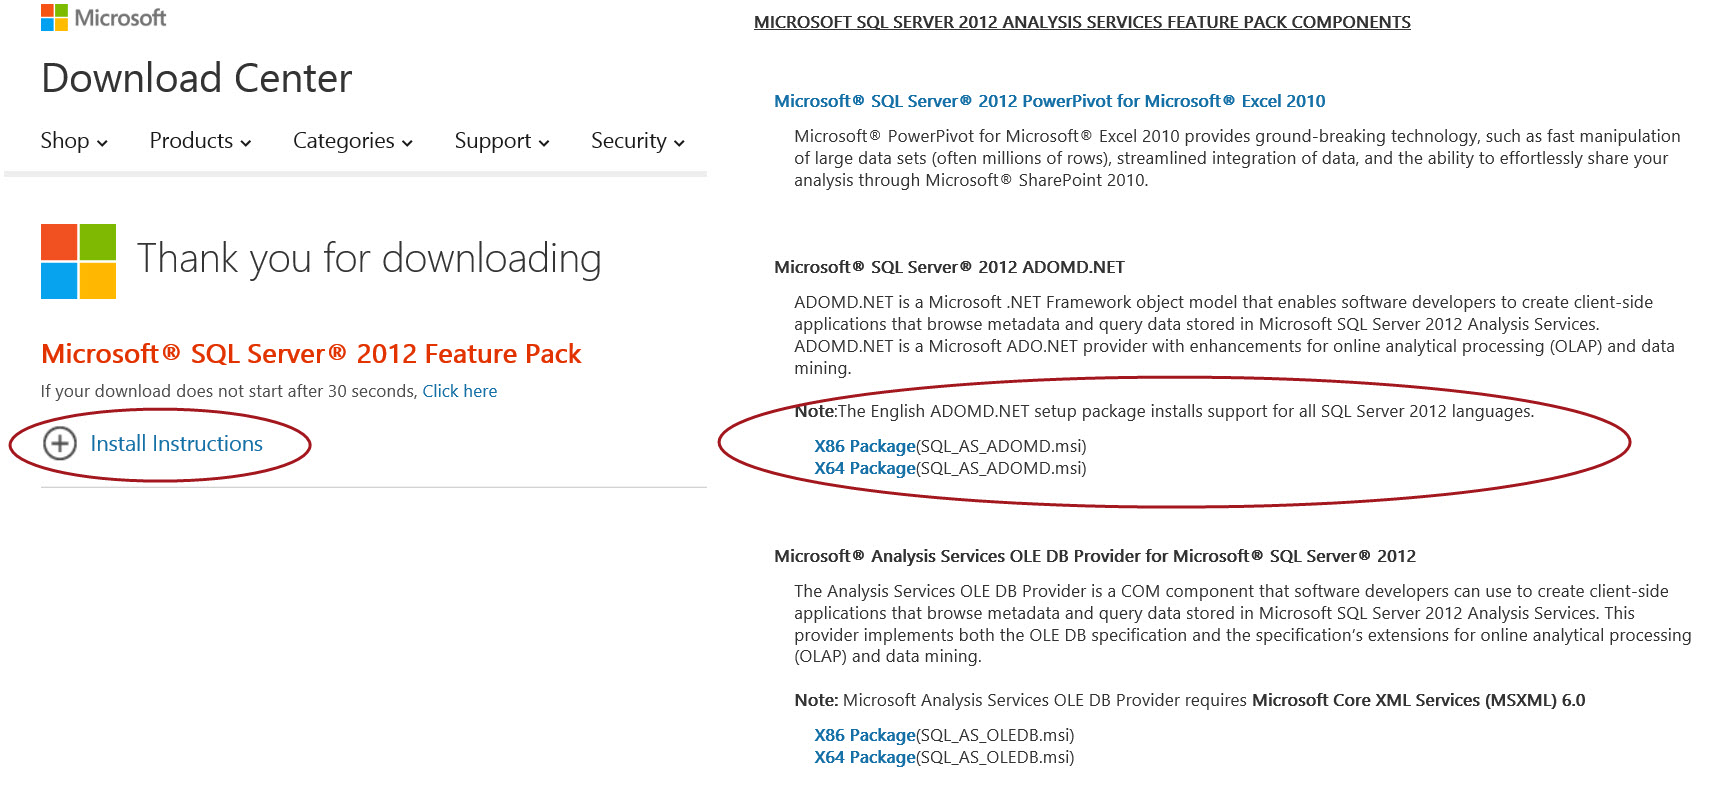
A prerequisite for connecting to SSAS from the Power BI Designer is installation of the ADOMD.NET data provider. This gets installed on your local machine (where Power BI Designer is installed). Even if you're running SQL Server 2014, it seems that it still wants the SQL Server 2012 provider at this point in time (I installed the 2014 provider first to align with my version of SQL Server but it didn't work). The ADOMD.NET provider can be downloaded from the SQL Server Feature Pack: http://www.microsoft.com/en-gb/download/confirmation.aspx?id=29065.  Expand the Install Instructions section, scroll down to the Microsoft SQL Server 2012 ADOMD.NET section about 1/4 of the way down the page. Choose x86 or the x64 file depending on if you're on a 32 or 64-bit machine.


To connect to SSAS, you start with the Get Data menu just like in the web. Under Database, find SQL Server Analysis Services Database then Connect.


Here's where things change from doing the connection via the website. Rather than show registered servers, it prompts you for the server name (including instance name if applicable):


The first time you make this connection, it'll prompt you for credentials. 


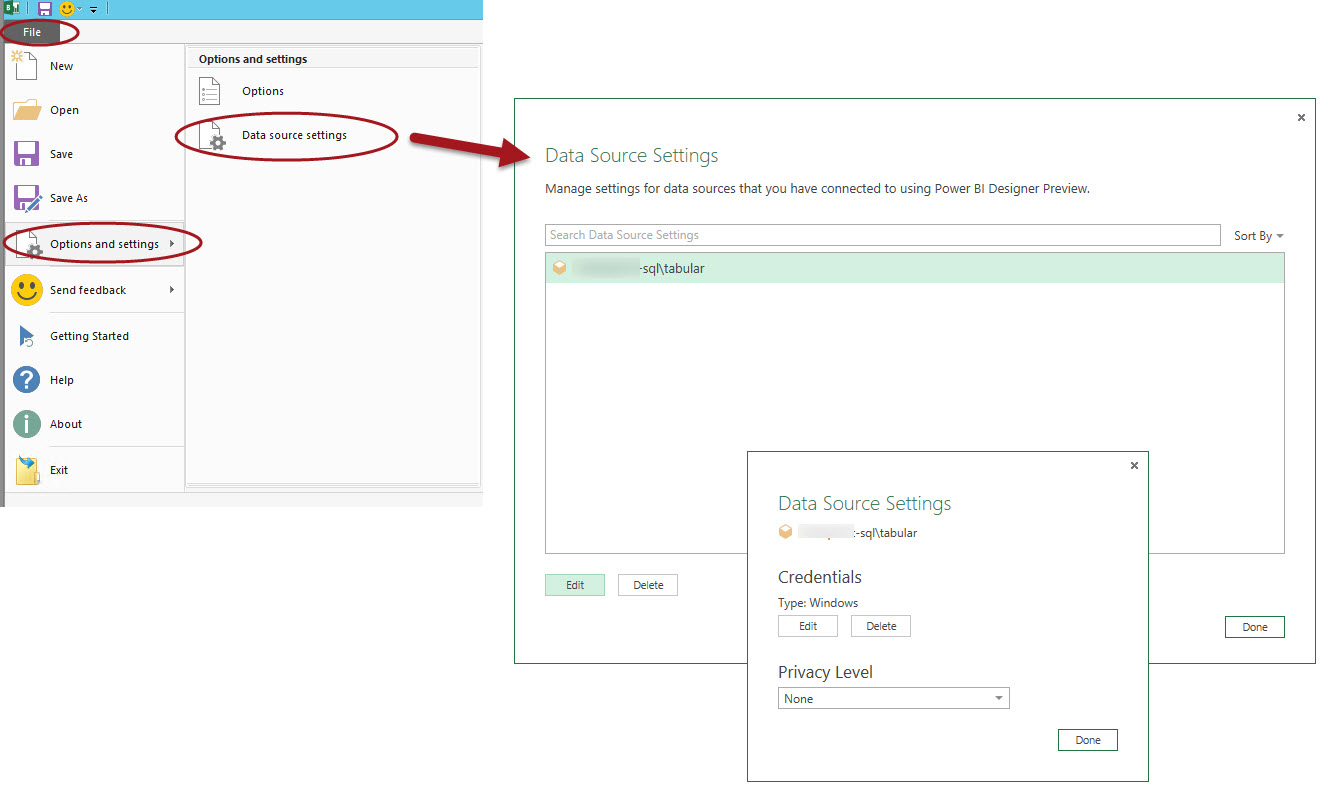
The next time you make this same SSAS connection, it won't need to ask you for credentials because it'll have your preferences stored. To review your saved data source credentials, go to File > Options and settings > Data source settings. Here you can edit or delete saved data source settings as needed.


After you've authenticated you'll be prompted for which tables of data to pull into the embedded data model. When you make multiple selections, the selected source tables will be flatted out into one single destination table. So in many cases you may want to import them each separately to preserve the categorization (though you'd need to have the keys for each table exposed in order to do that & in SSAS usually keys are hidden). Be sure to click Edit next so you can fine-tune the Query steps before the data gets loaded to the data model.


There's a contextual menu called Cube Tools that comes up when you're on the 'Added Items' step. At this point you can proceed with your normal Query steps to refine the output as desired.


Connecting to SSAS from Excel

Here's where I was planning to write up a summary of obtaining SSAS data 3 ways:  (1) Data menu ODC connection, (2) Power Query, (3) Power Pivot. However, while this post was sitting in draft status, John White wrote up a blog post covering this exact topic, so I'll just refer you to John's blog for details:  Using Excel with External Data - What's the Right Tool?    

Keep in mind that in Excel you have the choice as to whether to retain a direct connection or if you wish to store the data in the Excel Data Model. This is a very important decision point. As of right now, only options (2) and (3) are supported in the Power BI Preview, though I expect that'll change. In Excel 2016 these different options will be simplified which will be very nice.

And that's a wrap on this series about the SSAS Connector in the Power BI Preview. Thanks for reading!

Part I:   Overview of Using Analysis Services Data in the new Power BI Preview

Part II:  What You Need to Set Up the SSAS Connector in the new Power BI Preview

Part III: Monitoring the SSAS Connector in the Power BI Preview

Part IV:  Connecting to Analysis Services From Power BI Designer and Excel (you are here)

Why Bother Renaming Charts and Tables in Excel?

When you add a new chart or table to an Excel workbook, it gets a default name assigned by Excel. This is Chart1, Chart2, PivotTable1, PivotTable2, etc. It's always a good idea to rename tables and charts with a nice self-documenting description. But if you're like me, you may not have always taken the time to tidy up these names unless there's a formula or code actually referencing it. Here's a good reason to bother with names going forward...

Previews in Power BI, SharePoint Online, and OneDrive

In OneDrive and SharePoint Online (including Power BI when you're in the "regular" document library view), when you click the ellipses to show more options, it displays a nice little preview popup. Using the arrows, you can scroll through and see a preview of each chart and table contained in the file before you even open it.

Here's what the preview looks like. In this first example a default name of Chart12 is displayed.

Default name of Chart12

And here's what the preview looks like after the chart has been renamed...nice touch, huh?

Custom name of Sales Units Trend

Power BI Mobile App

Also, the Power BI mobile application displays pivot chart and pivot table names prominently at the top of each screen:


Updating Pivot Table and Chart Names

To update a Chart name, select the chart and go to PivotChart Tools > Analyze > Chart Name.

ChartName.png

To update a Table name, go to PivotTable Tools > Analyze > PivotTable Name.

That's it! Quick and easy. Your reward is that the preview mode in SharePoint Online, Power BI, and OneDrive will be a bit cleaner looking.

You Might Also Like...

Comparing Slicers to Standard PivotTable Filters


Getting New Power Pivot Features & Other Office 2013 Updates

New Power Pivot Features Released

Have you heard that Power Pivot just got a new Synonyms feature?  Synonyms associate column (attribute) names in a data model with alternate terms so that the Q&A Natural Language Query functionality in Power BI will be able to return results when users search for data using various terminology. Metadata like this will continue to to be more and more important in terms of making the user experience better, but metadata actually isn't what I want to write about today…today I want to focus on how to get new features like the Synonyms in Power Pivot as quickly as possible.

Starting with Excel 2013, Power Pivot is integrated into Excel’s data model. That makes Power Pivot currently dissimilar to Power Query which requires updates to be downloaded and installed. 

Just how do you get Office 2013 updates anyway?

How you get updates depends on how you installed Office 2013. There are two ways to install Office 2013:

  • The Click-to-Run type of installation, or
  • The traditional MSI Windows-based installer

I was inspired to investigate further because, when I checked for the new Synonyms feature in my version of Power Pivot, I didn’t have it yet.  This is because I currently have an MSI-based installation rather than Click-to-Run.

Most installations these days are Click-to-Run by default.  The MSI download media is typically only available to Microsoft customers who have a volume license agreement for Office 2013 or MSDN subscribers.

What is Click-To-Run?

Click-to-Run is a mechanism to install and update Office 2013 software products. It has been around a very long time, but has evolved to be much more sophisticated these days.

Like a traditional software installation, Click-to-Run still installs the Office programs on your local machine and uses local machine resources. However, the installation process is done via streaming which is broken up into small chunks to take it easy on bandwidth.  Even if you use Office 365 or Office on Demand sometimes, if you download the software package it does install and run from your machine.

By default, if you installed Office 2013 using the Click-to-Run method, the machine will receive automatic updates for Office 2013 (such as the update to Power Pivot mentioned at the very beginning of this blog entry). It handles installing the updates in the background during a time when the user isn't actively using components which need to be updated.  Although, depending on the kind of update, it’s possible the user will see a notification or a request for the app to be closed so it can proceed.

Interestingly, Click-to-Run is considered to be virtualized which means that all the Office 2013 program files are isolated.  This isolation allows programs to co-exist (such as Office 2010 and Office 2013 side by side).  The virtualization also allows it to continue to receive updates independently of Windows updates.  The streaming and virtualization behavior of Click-to-Run is based on Microsoft Application Virtualization (App-V) technologies.

The biggest benefit of Click-to-Run is that the updates are pushed automatically which means you don't need to install updates, service packs, or patches.  Users will probably love this – system administrators, well, maybe not all of them will love it. Click-to-Run also touts the benefit of being able to start using the software before it's finished installing.  It can do this because it sets up the most commonly used features first and continues to finish in the background.  These commonly used features are known as the “First Run Experience.” 

How to Check What Office Version You Have and if It's Click-To-Run or Not

To check the version that is installed:

  1. Launch Excel ( or any other Office app) and create a new workbook
  2. Choose File > Account

This is what it looks like if you do *not* have Click-to-Run:

image
image

If you do have Click-to-Run, you will also see this option on the Account page:

image
image

If automatic updates are enabled in the Update Options, then you should be getting the latest Office 2013 updates as they are released.  Although, new functionality like Synonyms that works in conjunction with Power BI for Office 365 will not arrive via updates (**See update at the bottom of this entry).

What if You Don't Have the Updates You Want?

If you’re in a corporate environment, chances are you won’t have much control over this as IT policies will dictate how Office is installed and updated.  System administrators are likely to handle installations using the Office Deployment Tool (ODT). 

If you do have the Click-to-Run version of Office 2013, make sure that updates are turned on (File > Account > Office Updates section).

If you have the MSI version of Office 2013, you have two choices:  One is to wait until the updates come through via the Windows update process (if it doesn’t conflict with your IT corporate policies, you can allow Windows updates to install automatically under Control Panel > Windows Update > Change Settings) or until you upgrade to the next version for certain updates like Synonyms (**See update at the bottom of this entry).  The other choice is to uninstall Office 2013 and reinstall it using a Click-to-Run version.  From what I’ve read, I believe you are able to keep your same product key.

Before you choose to reinstall Office 2013 with the Click-to-Run method, beware of the following limitations:

  • Not all add-ins and apps will behave the same way
  • Some functionality isn't available (such as SharePoint BCS or Edit in Datasheet functionality)

The full list of known issues can be found here:  http://office.microsoft.com/en-us/excel-help/click-to-run-known-issues-HA101850565.aspx.  On the positive side, search functionality in Outlook is more full-featured with the Click-to-Run.

There are multiple choices for where to download the Click-to-Run software from depending on how it was purchased.  You probably want to start with “My Office” found here:  https://office.microsoft.com/en-us/MyAccount.aspx or this link:  www.office.com/downloadoffice

Another way to download the Click-to-Run version of Office 2013 would be to log onto your Office 365 account.  Click the gear symbol at the top right, then Office 365 settings, then Software.  If you have the type of O365 account that provides the Office suite, then you’ll see the software listed there.  Additional FAQs can be found here:  https://downloadoffice.getmicrosoftkey.com/Home/SupportFAQ.

------------

** Update on 2014-02-26

Service Pack 1 for Office 2013 has been released.  However, the Synonyms functionality is not part of SP1 for MSI installations as described above. All indications point to Synonyms not being part of the MSI installation until the next version of Office.  Theoretically this makes sense for most customers because the Synonyms only works with Q&A which is part of Power BI for Office 365.  And, if you have Office 365, you probably have the Click-to-Run installation.  

Connectivity Requirements of Power View in Excel 2013

Overview:  Quick tip about using Power View in Excel 2013 re: how data refreshes are handled, as well as requirements for data connectivity and Internet connectivity.

Power View Refresh Behavior Upon Opening the Excel File

Recently I had an “aha” moment when I realized Power View acts differently than a PivotTable when you open a previously saved Excel 2013 file.  When you open an Excel file that has previously been saved, a PivotTable will render its last saved state (if the external data connection is *not* set to “Refresh data when opening the file”).  I usually explain to new self-service users that this behavior of a PivotTable can be a bit of a security hole if an Excel file is emailed to someone who doesn’t have formal security to see the data – the recipient can see the data last saved in the PivotTable but they couldn’t refresh it unless they have permission to do so (if the external data connection is *not* set to “Refresh data when opening the file”).

However…Power View does not behave the same way.  When you open a previously saved Excel file, it immediately wants to refresh the Power View sheet when you click on it.  As far as I’m aware, Power View cannot render its last saved state, nor can it render a snapshot as of a point in time.

For example, the following screen shot displays a Power View sheet where the external Tabular model data source is unavailable.  The Power View message says “Sorry, something went wrong while loading the model for the item or data source ‘DataSourceName’. Verify that the connection information is correct and that you have permissions to access the data source.”

image
image

This behavior tells us we need to have connectivity to our external data source in order to view the Power View report.

Online Connectivity Requirements for using Power View

From what I’ve learned so far, there are the following online requirements for Power View reporting in Excel:

  1. Access to External Data Sources (i.e., if accessing an external Tabular model instead of an embedded PowerPivot model).  This might mean a worker has to VPN into their office if using an Excel file while at home, for instance.
  2. Internet Connectivity if using Maps (Power View integrates with with Bing Maps).
  3. Internet Connectivity if using Image URLs (as opposed to binary images embedded in the data model).