Displaying Power Pivot Calculated Measures in Alphabetical Order

Sharing a quick tip I got the other day from Meagan Longoria...

See in this screen shot how the calculated measures are being displayed in random order in the PivotTable Field List? If you have a long list of measures, this can be a wee bit aggravating.


To fix it, click the gear symbol towards the top right of the PivotTable Field List. Change "Sort in Data Source Order" to "Sort A to Z."


And with that, we have a much more usable list to work with. I've noticed this setting isn't retained since I've had to reset the order of a file over and over as I refine the model, so that would be a really nice improvement at some point.


Power Pivot Update and Issue with Relationships Between Tables

Yesterday the Power BI team released a fantastic new update that improves the usability of Power Pivot inside of Excel. I'm thrilled with what I've seen so far as it removes a lot of the delays when making changes to the data model.

However...I have noticed one issue since the update. This morning I created a simplified data model in order to create a Power View demo for a customer who's not yet familiar with Power View's interactivity behavior. When putting together a sample Power View report I noticed the dreaded "Relationships between tables may be needed" message. 


There are times this message is accurate and expected (such as when you're purposely using disconnected tables). However, in this case, I knew something was wrong. Upon checking the Diagram View for the model, sure enough, the arrow was pointed in the wrong direction.

Prior to the update, I believe Power Pivot would reverse the arrow of the direction for you if it detected that you dragged it the "wrong" way -- i.e., it wants to point to the dimension table / lookup table / table with distinct set of values. So, I deleted the relationship and dragged it the correct direction and all was well.

So, keep an eye out for that behavior on the direction of the relationships.

You'll know you have the December update with the performance improvements if you are on 15.0.4675.1002 (File > Account).


Update 12/18/2014: It seems the "Relationships" message is also displaying sometimes when it's not truly applicable - ex: I'm seeing it when one explicit calculated measure from a single table is the only thing that has been added to a pivot table & I'm absolutely certain the relationships are defined accurately. 

You Might Also Like...

Getting New Power Pivot Features and Other Office 2013 Updates

When To Choose Analysis Services vs. Power Pivot?

The conversation about when to use SSAS vs. Power Pivot comes up a lot. Power Pivot is the data modeling component within the Power BI set of tools, and is suitable for certain self-service BI situations. Here's my top reasons when you may consider selecting Analysis Services instead, or when to upsize a Power Pivot model to an SSAS Tabular model.

This information is as of October 2014 and will definitely change as Power BI evolves and matures.

1. Row-Level Security. If the data returned needs to be secured based on what the user is permitted to see, that requirement usually justifies Analysis Services. Power Pivot supports file level security (i.e., either you see the data in the file or you don't). If you have a very small number of user groups, you could possibly still use Power Pivot. For example, let's say you have two divisions. You could secure the two division files differently to accomplish the need, and create two data sources in the Power BI Admin Center which use different credentials for the refresh. The tradeoff here is you'll have multiple workbooks to refresh, and any changes to reports and calculations and such would have to be done in each workbook.

2. High Data Volumes. Currently Power BI supports files at 250MB after the xVelocity compression is applied. Analysis Services can support much larger data volumes.

3. Minimal Data Latency. Currently you can schedule a refresh for a Power Pivot model in Power BI as often as once per day. Analysis Services processing can be scheduled in order to meet near-real-time needs if necessary.

4. Workbooks as a Data Source / Centralization of Data Model. Reports in Power BI currently require an embedded Power Pivot model. Now, this intermediary model can get data from many, many sources -- but currently the Power View, Power Map, and Excel reports need to be sourced from an internal Power Pivot model. This means the reports and data model are confined to one single XLSX file and not available for reuse. Inherently this provides for a limiting situation if you wish to centralize a data model and/or separate the reports from the model.

There are a few additional differences and considerations, but these four are the biggies that I find myself talking about pretty frequently.

Finding More Information

Comparing Analysis Services and Power Pivot

You Might Also Like...

Decisions: Power Pivot, SSAS Tabular, or SSAS Multidimensional Model in SQL Server 2012

How Often are Thumbnail Images Refreshed in the Power Pivot Gallery?

Overview:  A brief discussion of how and when the thumbnail preview images in a Power Pivot Gallery in SharePoint get refreshed.

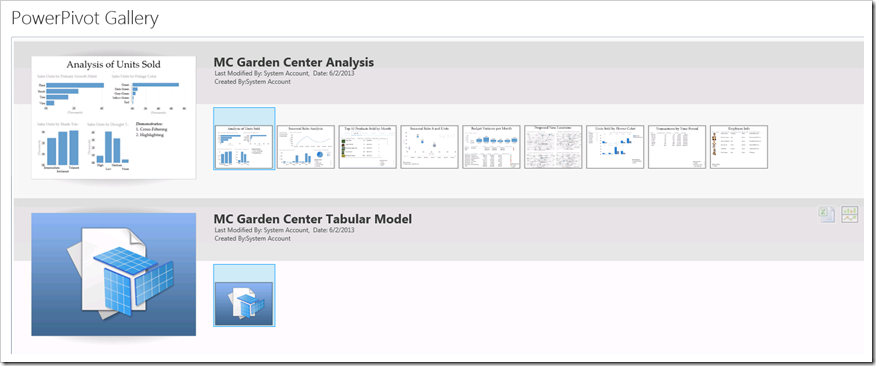
The Power Pivot Gallery is a specialized document library in SharePoint which utilizes Silverlight to render preview images of the report.  These previews are very helpful for users to quickly see if they have the correct report selected before executing it.

image

Ways to Refresh Thumbnail Images

Originally I had thought there would be a timer job which refreshes the thumbnails at a regular interval.  However, that is not the case.  There are 3 ways I’ve found to get thumbnails refreshed:

1.  Upload a new workbook.  The act of uploading a new workbook causes an event handler which will populate the thumbnail image for that workbook.

2.  Modify a workbook. The act of saving an existing workbook causes an event handler which will update the thumbnail image for that workbook.  Even if all you do is Edit Properties and then Save, that’s enough.

3.  Manually execute GallerySnapshot.exe.  This is a Windows service that runs on the app server where Excel Services is installed.  This exe gets called automatically when a file in the Power Pivot Gallery has been added or changed (an itemAdded or itemUpdated event, respectively, as mentioned in #1 and #2 above).  To run it manually, refer to this information:  http://blogs.msdn.com/b/mtn/archive/2010/10/15/how-to-manually-refresh-powerpivot-gallery-thumbnails.aspx.  Note that this service was called GetSnapshot.exe in SharePoint 2010, and has been renamed to GallerySnapshot.exe in SharePoint 2013.  The SharePoint 2013 GallerySnapshot.exe can be found at:  C:\Program Files\Common Files\Microsoft Shared\Web Server Extensions\15\BIN.

The takeaway:  Since the thumbnails only get regenerated in the above circumstances (and not at a regular interval), the preview images shouldn’t be thought of as something that is intended to coincide exactly with data updates.

Finding More Information

Technet – Refresh a Thumbnail Images

MSDN – Refreshing Power Pivot Gallery Thumbnails

Power Pivot Geek – General Problems with Gallery Snapshots Not Being Taken