
***Note this post applies to the SSAS Connector which has been deprecated as of mid-2016. Refer instead to the Power BI Enterprise Gateway.***
Welcome to part 3 of a 4-part series on using the SSAS Connector with the new Power BI Preview. This information is as of early March 2015 and is subject to change as the Power BI Preview evolves.
Part I: Overview of Using Analysis Services Data in the new Power BI Preview
Part II: What You Need to Set Up the SSAS Connector in the new Power BI Preview
Part III: Monitoring the SSAS Connector in the Power BI Preview (you are here)
Part IV: Connecting to Analysis Services From Power BI Designer and Excel
What's Going On When the SSAS Connector Is Running?
As we discussed in Part 1, the SSAS Connector allows Power BI to display data that is stored in an Analysis Services Tabular model. What's happening:
- Reports: Refreshed on-demand from user interaction
- Dashboards: Refreshed automatically by the system
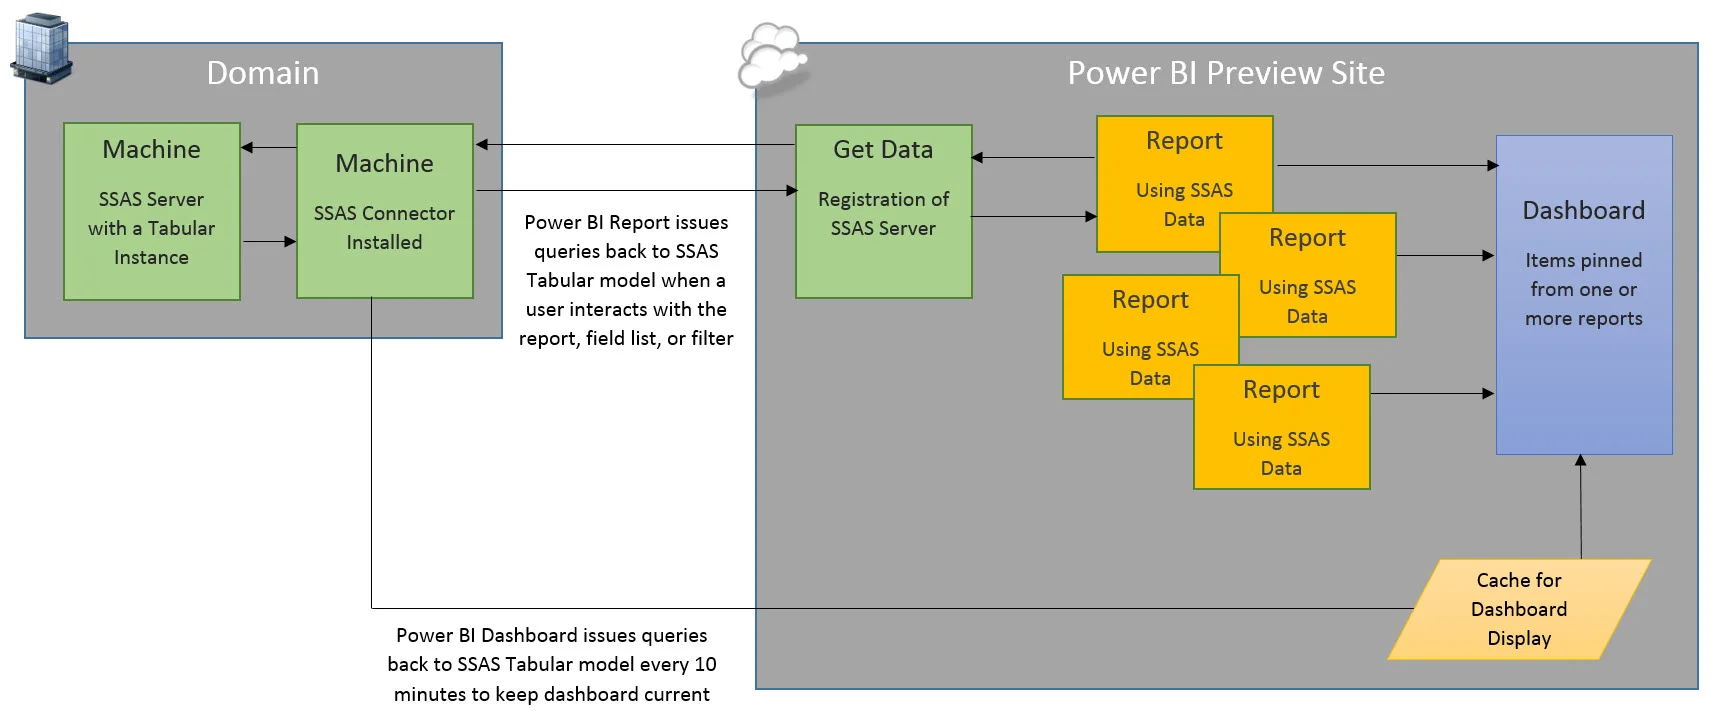
A Power BI report issues queries back to SSAS Tabular model when a user interacts with the report, field list, or filter.
A Power BI dashboard issues queries back to SSAS Tabular model every 10 minutes to keep the dashboard current. It does this without a refresh schedule being enabled (which isn't necessary in Power BI for an SSAS Tabular model anyway).

If you have a lot of users and a lot of dashboards, that's a lot of queries happening automatically. At this time, the 10-minute refresh interval is not configurable -- that's one of my wish list items. Most commonly I see an SSAS tabular model being refreshed daily by a job which makes Power BI refreshes every 10 minutes a slight bit of overkill. So the ability to scale this back would be very helpful to manage the SSAS server load.
Monitoring SSAS Queries Being Sent to Power BI with SQL Server Profiler
First, a quick word about Profiler. It is deprecated for the SQL Server Engine, but not officially for Analysis Services yet according to this MSDN documentation. However, many database professionals are starting to rely more on Extended Events instead of Profiler for both the DB Engine and SSAS because Extended Events are less taxing on the system and have far more events that can be captured. Since Profiler is familiar let's start with that though. In the next section we'll show Extended Events. For purposes of this first example, we'll keep it simple and use the Profiler GUI for our trace (with a Production server, you obviously want to do that cautiously so as not to significantly impact performance).
If you fire up Profiler and start a trace on the Analysis Services instance, look for three things: the NTUserName, the EffectiveUserName associated to the Query Begin event, and the ApplicationName which is Power BI.

In the above screen shot:
- NTUserName: This is the account with SSAS administrator permissions used when the SSAS Connector was configured. Preferably this is a domain service account, not associated to a user, with a password that doesn't expire.
- EffectiveUserName: Updated 7/24/2015 This is the active user who is viewing the dashboard - i.e., issuing the query. As of the Power BI GA release on 7/24, the effective user name now follows through to the recipient of a shared dashboard so that row-level security is honored.
EffectiveUserName: When the active user is also the original author, this is the active user. When the active user is viewing a dashboard that's been shared with them, the EffectiveUserName is still the original author -- not the active user.
Monitoring SSAS Queries Being Sent to Power BI with Extended Events
Since there's not yet a GUI for setting up Extended Events in SSAS, the starting place is an XMLA query window in Management Studio. Below is an example of a small trace I let run on the SSAS server for a couple of minutes. I did borrow Bill Anton's script as a starting point for this example. Both Mark Vallincourt and Bill Anton have much more thorough discussions about this topic if you want to read more.

The only thing I cared about this time was tracing was the QueryBegin event.
<Create
xmlns="http://schemas.microsoft.com/analysisservices/2003/engine"
xmlns:xsi="http://www.w3.org/2001/XMLSchema-instance"
xmlns:ddl2="http://schemas.microsoft.com/analysisservices/2003/engine/2"
xmlns:ddl2_2="http://schemas.microsoft.com/analysisservices/2003/engine/2/2"
xmlns:ddl100_100="http://schemas.microsoft.com/analysisservices/2008/engine/100/100"
xmlns:ddl200_200="http://schemas.microsoft.com/analysisservices/2010/engine/200/200"
xmlns:ddl300_300="http://schemas.microsoft.com/analysisservices/2011/engine/300/300">
<ObjectDefinition>
 <Trace>
<ID>9</ID>
<Name>QueryBeginTracing</Name>
<ddl300_300:XEvent>
 <event_session
  name="SSAS_9_10"
dispatchLatency="1"
maxEventSize="4"
maxMemory="4"
memoryPartitionMode="none"
eventRetentionMode="allowSingleEventLoss"
trackCausality="true">
<event package="AS" name="QueryBegin" />
<target package="Package0" name="event_file">
<parameter name="filename" value="SSASTrace_QueryBegin.xel" />
</target>
 </event_session>
</ddl300_300:XEvent>
 </Trace>
</ObjectDefinition>
</Create>
After the trace starts, it creates an .xel file in your SSAS log folder.

If you double-click the .xel file, it'll open for viewing in Management Studio. Here's what it looks like when you first open it:

You can start right-clicking detail items to display as columns in the table in the top half of the screen.

If you expand RequestProperties, you'll see the EffectiveUserName there. So here in the Extended Events trace we have all the same information we saw in Profiler, plus more, just in a different format. You can also trace more events if you'd like of course. Info on SSAS trace events can be found here.
Oh, and don't forget to stop your traces from running.
<Delete xmlns="http://schemas.microsoft.com/analysisservices/2003/engine">
<Object>
<TraceID>9</TraceID>
</Object>
</Delete>
If you need to double check what's running against your SSAS Tabular instance, check the Discover_Traces DMV. In the following screen shot, you can see I've got two traces running: one is my Profiler session, and the other is my Extended Events session. The Flight Recorder will be there too if you have it enabled in your SSAS server properties.

SELECT * FROM $system.discover_traces
Monitoring SSAS Server Resources Associated with the SSAS Connector
Here's where you use the same tools and techniques you use to monitor your server health, whether it be PerfMon, Activity Monitor, a third party tool, and so forth. A few things I've observed from the default installation of the SSAS Connector:
Windows Events
Events related to the SSAS Connector are classified as the "Data Management Gateway" log.

Reminder: The SSAS Connector cannot currently co-exist on the same machine as a Data Management Gateway (from Power BI for O365). So even though the log naming of services and events are the Data Management Gateway, it's really the SSAS Connector. I guess this means the SSAS Connector is a special type of Data Management Gateway, but different than the one associated with Power BI for O365.
Windows Service
The Windows Service associated with the SSAS Connector is run by: NT SERVICE\DIAHostService.

Local Group
When the SSAS Connector is installed, a local group called "Data Management Gateway Users" is created. The person who installed and configured the SSAS Connector is who is initially added to the group. So in my case, I configured the SSAS Connector so I'm the person initially added to the group (even though I specified the PowerBISvcAccount credentials as the administrator).

Firewall Ports
The SSAS Connector installation sets up the following inbound rules associated to DIAHost.exe and DIAWP.exe:

Managing the Password for the SSAS Connector
Lots of organizations have security policies which dictate user passwords change on a regular interval. If the SSAS Connector were set up with a user's credentials, and the password expires, then the SSAS Connector stops functioning. That's because the ID and PW are stored by the SSAS Connector.

Therefore, unless your policy dictates otherwise you may want to set up the SSAS Connector with a domain service account with a password that doesn't expire frequently.
Part I: Overview of Using Analysis Services Data in the new Power BI Preview
Part II: What You Need to Set Up the SSAS Connector in the new Power BI Preview
Part III: Monitoring the SSAS Connector in the Power BI Preview (you are here)
Part IV: Connecting to Analysis Services From Power BI Designer and Excel