Overview of Power BI V2 Features End-to-End

***********************************

UPDATE September 2019: Please see the diagrams page on my Coates Data Strategies site for the latest diagram. The one shown below is severely out of date.

***********************************

Back when we were using Power BI for Office 365 (V1), I did an end-to-end feature diagram. Since the first one was popular, here's an updated diagram for the "new" Power BI (V2).

Note the above is accurate to the best of my knowledge as of the date in the top left of the image. The pace of change is fast, so please be sure to verify.

You Might Also Like...

Ways to Utilize Power BI in a Bimodal BI Environment

Direct Connect Options in Power BI for Live Querying of a Data Source

Groups in Power BI - How Sharing and Security Works

This past week, groups in Power BI came up multiple times. This post is to give a quick overview of what you can and cannot currently do with groups in Power BI V2. This info is as of mid Sept 2015; features and functionality are evolving fast and furious so be sure to verify at a later date.  

**Updates to this post since it was originally published mid Sept 2015:

  • 9/23/15 due to release of new Group sharing functionality
  • 10/23/15 due to release of read-only members within Groups
  • 11/1/15 due to addition of support for sharing to Active Directory security groups

In V1 of Power BI, I was a big fan of using SharePoint Online sites and document libraries to organize content by subject area and/or serve as a security boundary. Groups are the replacement in Power BI V2 for organizing content and/or securing content for groups of users. Since groups represent an organizational feature, they're only available to Power BI Pro users (not the free version of Power BI).

What Are Power BI Groups?

Groups in Power BI are not really "just" Power BI Groups. Rather, they are Office 365 unified groups which can be used across a number of apps. The type of groups we'll see exposed in Power BI are similar to distribution groups (but a little different from distribution groups & security groups). A new O365 unified group gets a group e-mail account, file space in a OneDrive location, shared calendar, and other collaboration features. You can set up Azure Active Directory Sync (AADSync) to synchronize on-premises AD group members with Office 365 group members.

The first thing to be aware of when evaluating use of groups is that there are multiple types of workspaces in Power BI:  My Workspace and Group Workspace. Each type of workspace can contain its own datasets, reports, and dashboards. As you would expect, each user has only one My Workspace whereas there can be numerous Group Workspaces.

 
PowerBIWorkspaceMenu.jpg

To see Groups in the Power BI web portal, click the arrow (chevron) at the top left. It points up or down depending on whether the group list is expanded or not.

Using the + sign you can create a new O365 unified group for use in Power BI.

Each group that the logged-in user is a member of will appear in the list of group workspaces.

How Does Sharing & Security Work with Groups in Power BI?

First let's talk about sharing out of My Workspace. You can share a dashboard with one or more coworkers out of your personal workspace. Note that you cannot share reports or datasets from My Workspace.

Within a Group Workspace, however, you have two choices:  

  • Share the dashboard with a recipient. Just like in My Workspace, sharing a dashboard is a read-only for the recipient. The recipient will see the shared dashboard within their own personal workspace.  Or,
  • Add a user as a member of the group. The group members will view the content within the group itself (rather than in their personal workspace).

Therefore, the Group Workspace offers a lot more flexibility than dashboards shared out of My Workspace because group members can utilize dashboards, reports and possibly datasets depending on member permissions. 

For all members in a group, the member permissions can be set to either:

  • Members can edit Power BI content, or
  • Members can only view Power BI content

Notice in the following screen shot how the privacy setting for edit vs. view applies to all members in the group. At the individual member level, I can specify an individual to be Member or Admin. However, what I cannot do is specify the type of member, edit vs view, at the individual user level.


Be sure to devote some time to planning how you want security of groups to work as it relates to delivering content organized by subject area, topic, user base, etc.

What Group Members See in Power BI

For members in a group that are set to view only, note how they don't see the Datasets, nor is the Edit Report menu option enabled:


Alternatively, as you expect, for members with edit capabilities, they see everything in the group, and have the ability to edit all objects in the group:


Ways to Publish Read-Only Content in Power BI

To summarize overall options, there's four ways I'm aware of to share read-only content:

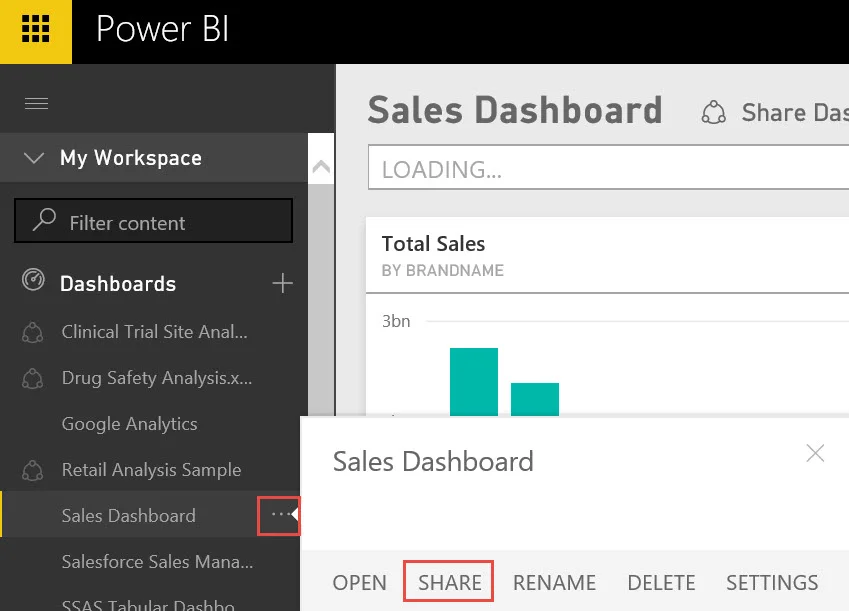
First option is to share dashboards via your personal workspace. That ensures the recipient does receive a read-only copy. In this situation, only one person (the original author that did the sharing) can make edits. **Note: this is not a great practice for critical reporting - if the original author leaves the company, it is a hassle to reset the password and get into their account to retrieve original items--especially because we cannot yet export datasets/reports/dashboards from the Power BI services. It's better to use groups for housing original content that is important to a number of users.**

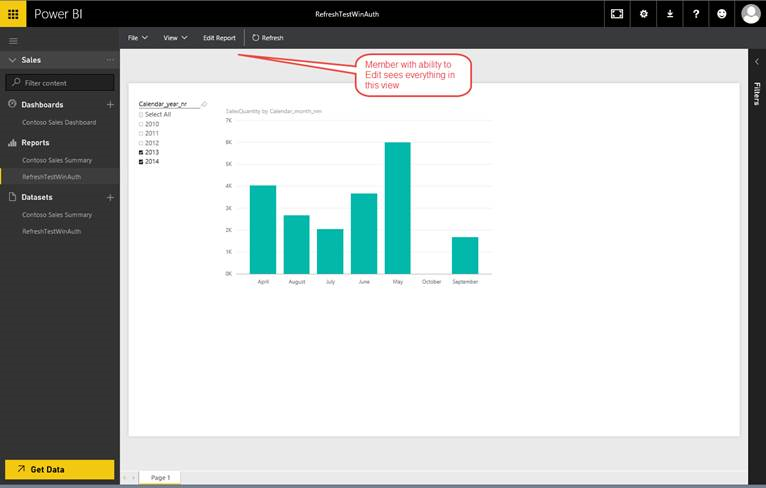
Second alternative is to share dashboards via group workspace. That ensures the recipient receives a read-only copy. Any group admin or members with edit permissions can edit the original content.

Third way is to add "view only" members to a group. In this case, users will go to the group to view content, rather than their My Workspace. This is helpful when you want to organize content across subject areas. In this situation, only group admins will be able to edit the original content (because *all* members will be view only).

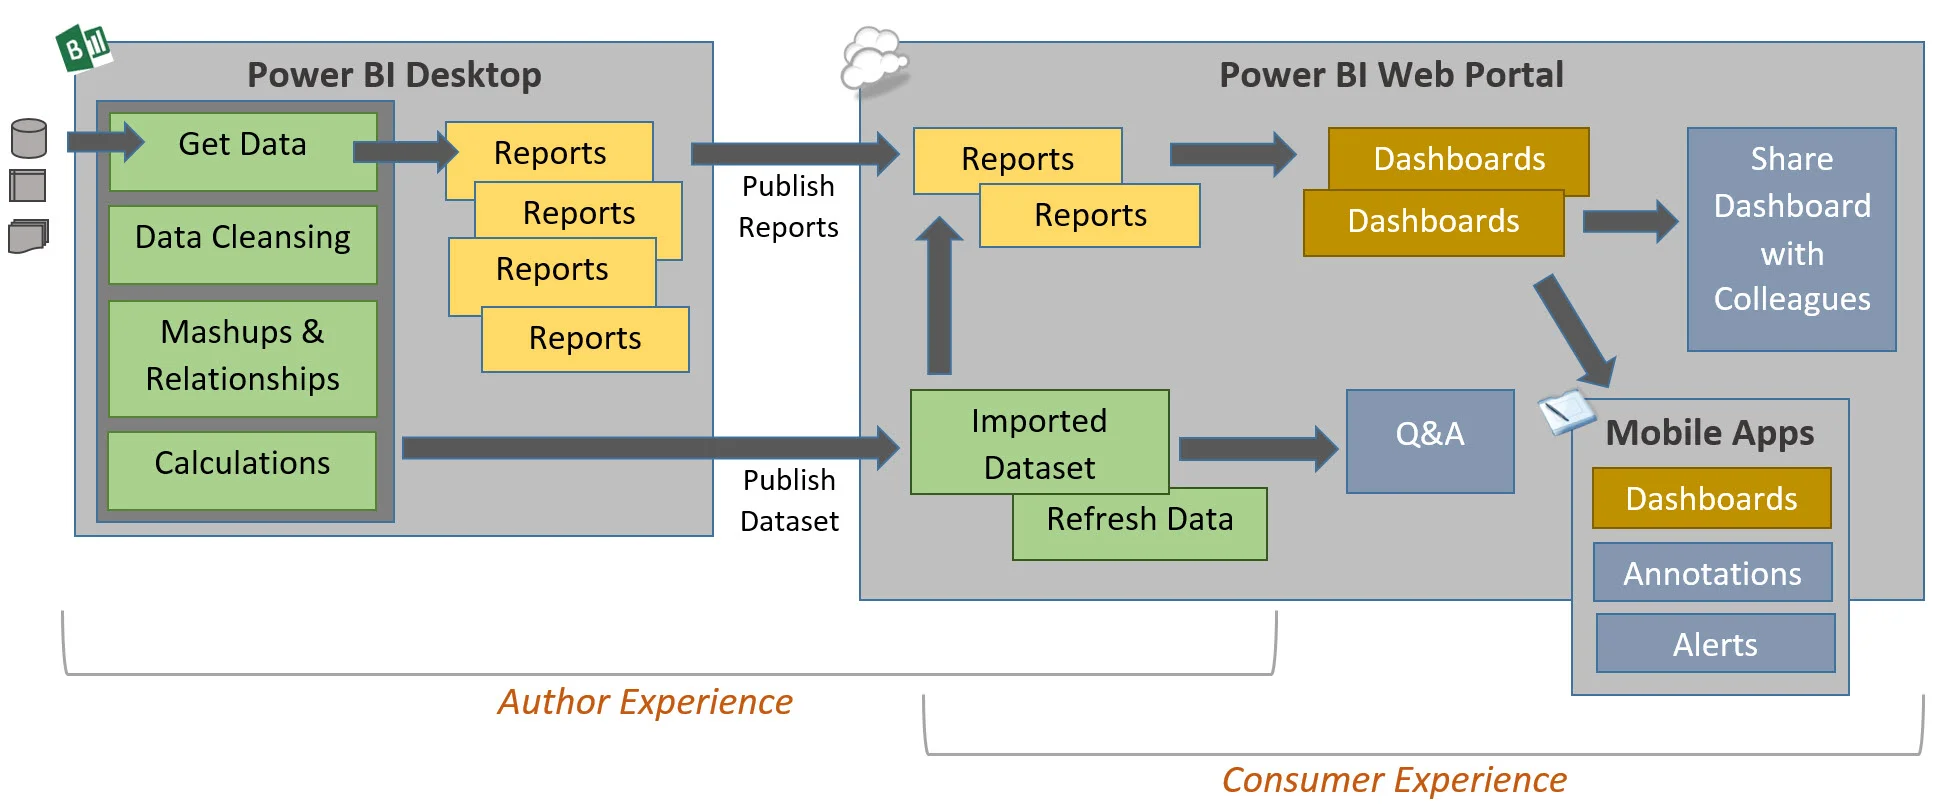
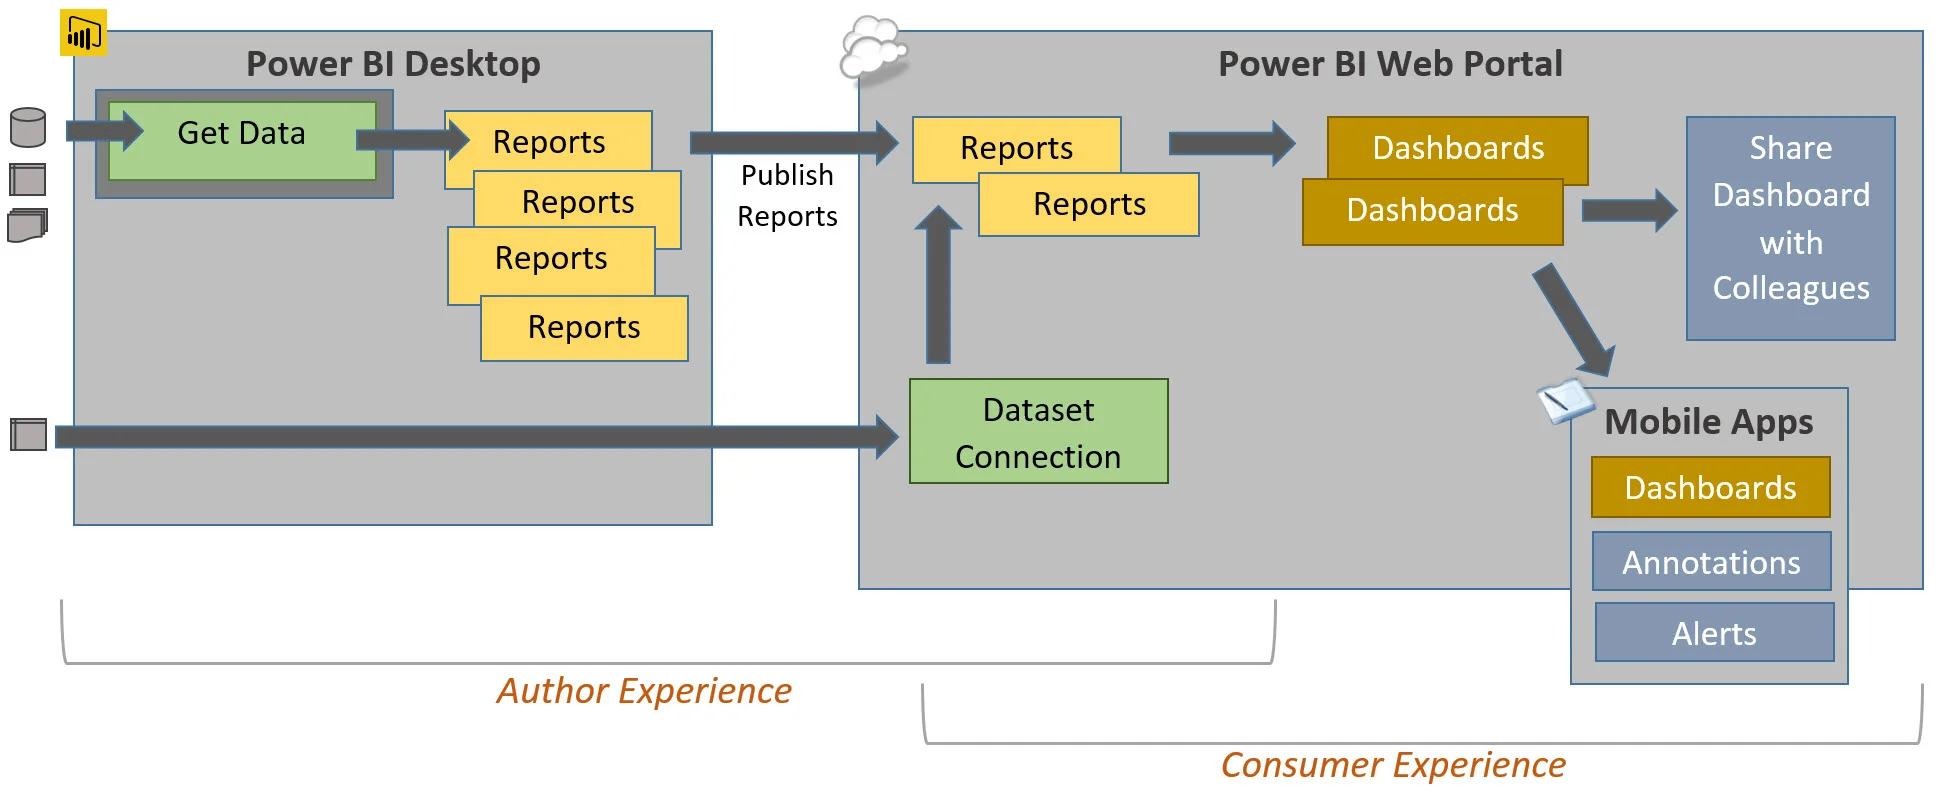
Fourth option is to publish the content via an organizational content pack. Individual users can use the "Get Data" functionality to discover the content. They'll bring the dataset / report / dashboard into their own My Workspace. If the user wishes to make changes, Power BI will prompt them to create a second (personalized) copy. This is a good option, but two copies could get confusing for some users. Also, this isn't a big deal, but it does put the "burden" on individual users to go out and find the content via Get Data.  Neither are deal breakers, but something to be aware of depending on the user base. Another thing to keep in mind is that if a user personalizes something they got from a content pack, there's nothing preventing them from turning around and sharing their personalized dashboard back out again.

A Few More FYIs About Using Groups

The view only setting for group members is only acknowledged inside of Power BI. Which means the view only permissions does *not* translate to files in OneDrive for that O365 unified group (though a recent webcast indicated that OneDrive continues to respect the first edit vs. view-only setting that was specified for a group & that a subsequent change would *only* affect Power BI and not OneDrive for the group--definitely test it and see though). Specifically, this impacts Excel files that are uploaded to OneDrive so that Power BI can connect to them and launch an Excel Services window for viewing. As other report types continue to be integrated with Power BI (such as SSRS), it'll be interesting to see how this evolves.

Also, it appears that groups created outside of Power BI don't have the capability enabled to set view-only vs edit permissions for the members. So be sure to keep an eye on this as you're setting things up. If you can create the unified group directly in Power BI, that seems to work most seamlessly.

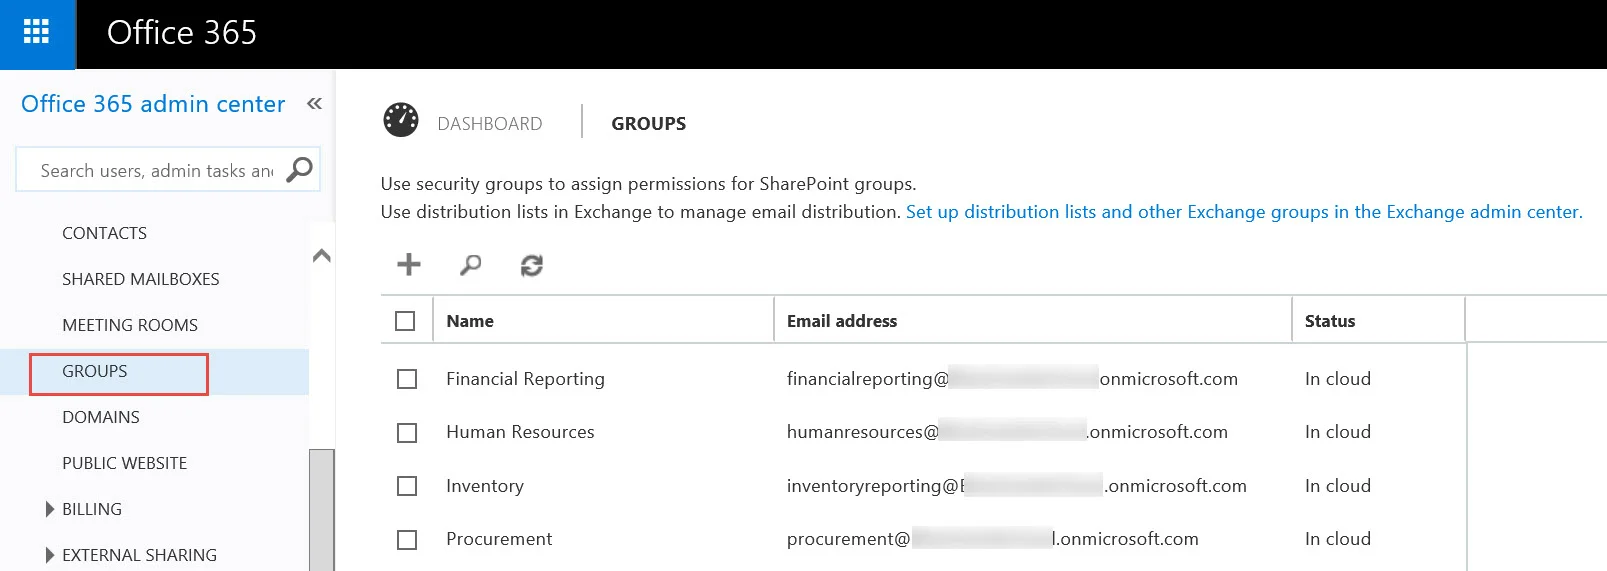
After a new group has been created in Power BI (or People or OWA), it will appear in the Office 365 Admin Center (you need to have Office 365 administrator privileges in order to get to this area). 

I noticed that groups created directly in the O365 Admin Center Groups pane don't show up in Power BI. At first I thought that was a problem. However, after a bit of research, I understand that it's because when using the O365 Admin Center Groups pane (shown in the screen shot above) it's created as a security group rather than the new-fangled O365 group. However, if you create a group through the People section or OWA or Power BI, it'll be created as a the type of group which can be utilized in Power BI like we expect.

Also, I've not had a chance to test this but I've read that if you have any policies set up (for group naming, mailbox policies, etc), the Power BI group creation process isn't necessarily yet aware of all policies. Since by default any user can create a group, some system administrators have set up policies to get around this to avoid disorganization. So you'll want to test that out to verify as well.

You Might Also Like...

Ways to Utilize Power BI in a Bimodal BI Environment

Direct Connect Options in Power BI for Live Querying of a Data Source

Overview of Azure Data Catalog in the Cortana Analytics Suite

Azure Data Catalog is one of the components of the Cortana Analytics Suite (now renamed to Cortana Intelligence Suite).  This post is as of September 2015; at this time the Azure Data Catalog is still in public preview so we can expect many changes coming soon.

Check here for a brief video tour: Tour of Azure Data Catalog.

If you saw the data catalog that was part of V1 Power BI (for Office 365), then you are familiar with the first iteration of this tool. Customer feedback was good, but that they didn't want to go through the trouble of registering data sources for use with just one application. So that's the motivation for pulling it out of being a Power BI feature and into being a full-fledged element of the Cortana Analytics Suite.

The Azure Data Catalog is two things:

  • Enterprise-wide catalog in Azure that enables self-service discovery of data from any source (on prem or cloud, Microsoft or non-Microsoft, structured or non-structured)
  • A metadata repository that allows users to register, annotate, discover, understand, and consume data sources

I'm very excited to have a metadata repository like this which can save people time, help find the info they need, share what the data means as well as issues and advice, and potentially decrease duplication of effort for things which already exist. Check out this Azure Documentation page for some very useful scenarios and use cases for Azure Data Catalog:  https://azure.microsoft.com/en-us/documentation/articles/data-catalog-common-scenarios/.
    
The primary activities in the Azure Data Catalog: Publish (aka Register), Discover, and Annotate. The publishing process currently uses a click-once app in a web browser, and the discovery and annotation process is done via a web page (unless you prefer to use the open APIs).

Publishing / Registering Data Sources in Azure Data Catalog

When a user registers a data source, the catalog extracts out the connection string and metadata for column names and data types.  It also will extract descriptions / extended properties if present in the source. Optionally, the person handling the data source registration can choose to show a preview of the data (up to 20 records), and/or a profile of the data. Other than the optional 20-record preview, none of the actual data contents are moved to Azure - it's metadata only.

The above screen shot shows the data sources supported currently in the public preview. Due to customer feedback, the development team started with on-premises SQL Server (relational) and Analysis Services (both multidimensional and tabular). It's also very interesting that Reporting Services reports can be cataloged here as well.

Lots more data sources will be coming soon - their aim is to be able to register all enterprise data sources after all. The list of supported sources can be found here: https://azure.microsoft.com/en-us/documentation/articles/data-catalog-frequently-asked-questions/.

Discovering Data Sources in Azure Data Catalog

When looking for a data source that has been registered, users can search by term, tag, object type, source type, and/or an expert assigned as having knowledge of the source. (This expert can be a person or perhaps a support group.)

The web interface includes nice functionality to select multiple items on a page and assign tags, for instance, to them all at once.

If the "Include Preview" checkbox was selected when the data source was initially registered, this is what the Preview pane looks like:

Note that individual columns can possess their own tags and descriptions for search ability (in addition to the tags and descriptions at the database & table levels). This is what the Columns pane looks like:

If the "Include Data Profile" checkbox was selected when the data source was initially registered, then table and column profiling is done with respect to number of rows, number of distinct values, min & max values, number of nulls, etc. Following is what the Data Profile pane looks like:

Annotating Data Sources in Azure Data Catalog

Users are encouraged to make annotations about usefulness, column meanings, friendly names, etc. The development team refers to this as a crowdsourcing approach because anyone can contribute useful information that may be of great assistance & time savings to colleagues.

Tags can also be used very effectively. For example, I saw a demo recently where an e-mail address column was annotated with a PII tag to alert users to use caution when distributing personally identifiable information.

If users of the Azure Data Catalog make the time investment to add rich information related to data sources, then this type of metadata tool can be extremely helpful to self-service users who are searching for the correct data to use. 


Things to Know about Azure Data Catalog

There is a web portal interface to Azure Data Catalog is located at http://azuredatacatalog.com. However, there are also open APIs as well if you would rather integrate the publishing, discovering, and annotation activities with a custom application. 

The Azure Data Catalog permits a data source to be registered only once. This was a purposeful design decision to avoid duplicates. Visibility to a select number of objects (ex: views for particular sets of users) can be set with security (in the Standard version only, not the free version).

Currently the system allows only a single Data Catalog per Azure subscription. The design team has envisioned the Azure Data Catalog as being enterprise-level, so permitting departmental use would diminish the value. It'll be interesting to see over time how the subscription model tends to align within decentralized customer organizations.

Azure Active Directory integration is required. You *cannot* use a Microsoft account (ex: user@outlook.com) with Azure Data Catalog. 

The default for a new data source is for its metadata (and data preview, if selected) to be available to everyone. Visibility can be set to specific users and groups (Standard version only, not the free version).

There is a free version, and a paid version that is referred to as the Standard version. The free version shows all registered data sources to all users - if you need to restrict visibility by users & groups, that requires the Standard version. The free version allows up to a max of 50 users, whereas the Standard version is unlimited and is priced (as of Sept 2015) at $50/per month/per 100 users. Pricing details are here:  https://azure.microsoft.com/en-us/pricing/details/data-catalog/.

If a user doesn't have permission to access a data source, the Standard version (not free version) allows you to submit a request to gain access to that particular data.

Anyone can try to register a data source. However, for it to be successful, the person registering needs to be able to read the schema for the underlying data source (i.e., read definition permission). If the checkbox to show a preview is selected, the person registering also needs select permissions on the underlying data source.

You MIght Also Like...

What is the Cortana Analytics Suite?

Direct Connect Options in Power BI for Live Querying of a Data Source

In a recent Power BI post, I wrote about two ways to utilize Power BI: one being the "Report Only" and the other including the "Query, Model and Report" alternative. Since then I've done a Power BI POC for a new customer and seen a couple of twitter comments that inspired me to write about this in a bit more detail.

**Updates to this post since it was originally published mid Sept 2015:

  • 1/9/16 due to release of Enterprise Gateway

Direct Connect - aka Live Query - 'Pull' Options in Power BI

The direct connect option aligns with the "Report Only" use I talked about in my other post. Why is this a big deal? We've all heard of the 'one version of the truth' aspiration. And while the flexibility and empowerment of self-service BI is indeed incredibly important, so is utilization of a centralized data source that users trust. It may be that there's been a significant investment in a data store that we want to take advantage of in Power BI without bringing the data into an intermediary layer. Or the data volumes are too large for an embedded model. Or we want to take advantage of row-level security. Or we have security restrictions on the ability to replicate data.

As of Jan 2016, there are the following direct connect options in Power BI that involve a 'pull' approach:

  • Analysis Services Tabular Model (Live Connection via Enterprise Gateway)
  • Analysis Services Multidimensional Model (Live Connection via Enterprise Gateway)
  • SQL Server (DirectQuery via Enterprise Gateway)
  • SAP HANA (DirectQuery via Enterprise Gateway)
  • Azure SQL Database
  • Azure SQL Data Warehouse
  • Spark (on HDInsight or on-premises)

The Enterprise Gateway is the successor to the SSAS Connector. Via the Enterprise Gateway, there are two modes for live queries: DirectQuery and Live Connection. Conceptually they do the same thing, but apparently there is actually a distinction therefore different lingo.

A live connection to an SSAS Tabular or an SSAS Multidmensional model is the only option which supports row-level security using roles associated to Windows authentication (for now anyway). Although Azure SQL Database has new row-level security capabilities now, its functionality is associated to database users rather than Windows authentication so it's not currently supported for this purpose in Power BI. 

When in Live Connection mode, note how it looks a little different in the Power BI Desktop:  there is no Data pane, no Relationships pane, and the Edit Queries dialog box doesn't show anything except the connection.

How the SSAS Tabular direct connection looks in Power BI Desktop

How the SSAS Tabular direct connection looks in Power BI Desktop

SSAS Choices in Power BI Desktop

SSAS Choices in Power BI Desktop


Near Real-Time 'Push' Options in Power BI

In addition to the 4 'pull' methods listed above, there are 2 'push' methods currently supported: streaming data and APIs, both which can be used for near-real-time analysis. These options are not exactly direct connect since they send data to an embedded model in the Power BI service, but it's close enough that I thought it warranted mentioning here.

Process for exposing streaming data to Power BI

Process for exposing streaming data to Power BI

The above chart displays the high level process for exposing streaming data to Power BI.  The Azure Event Hub communicates with the data source. Azure Stream Analytics takes this input from the Event Hub and outputs it to Power BI. In addition to the temporary streaming data, you can route some or all of the data from Stream Analytics to a persisted data location as well (which could potentially give Power BI another option for reporting on the history of this data in addition to the live stream).

More info on the APIs can be found in the Power BI Developer Center.

What Is Different with the Direct Connect (Report Only) Live Query Method?

During a recent proof of concept project, the customer asked me if all of the functionality under 'Edit Queries' is there if you are working in the direct connect mode. The answer is no. 

This next screen shot shows what the flow looks like when you utilize the embedded data model (the "Query, Model, and Report" alternative). 

The full Query>Model>Report approach

The full Query>Model>Report approach

Conversely, all of the options to manage the data are eliminated when in direct connect mode (the "Report Only" alternative). Usage of Power BI Desktop becomes quite optional actually, as report authoring could easily occur right in the web browser.

The Report Only approach (direct query / direct connect)

The Report Only approach (direct query / direct connect)

So, my main takeaway is that the fundamentals of both approaches are very different, but there are use cases for using both alternatives.

You Might Also Like..

Ways to Utilize Power BI in a Bimodal BI Environment

Will the Real Power BI Please Stand Up?