
This is part 1 of 3 about Azure Analysis Services (Azure AS) which was announced a few days ago. Azure AS is a Platform-as-a-Service (PaaS) offering which is currently in public preview mode at the time of this writing (late October 2016).
Part 1: Why a Semantic Layer Like Azure Analysis Services is Relevant {you are here}
Part 2: Use Cases for Azure Analysis Services
Part 3: Where Azure Analysis Services Fits Into BI & Analytics Architecture
Fundamentally, Analysis Services serves as a semantic layer (see below for further discussion of a semantic layer). Because the business intelligence industry now embraces an array of technology choices, sometimes it seems like a semantic layer is no longer valued like it once was. Well, my opinion is that for many businesses, a semantic layer is tremendously important to support the majority of business users who do *not* want to do their own data wrangling, data prep, and data modeling activities.
Let's first do a super quick recap what Analysis Services is.
Analysis Services Primer
Analysis Services can be categorized with competitor tools such as Business Objects Universe, Cognos Framework Manager, or AtScale.
Prior to the introduction of Azure AS, Analysis Services was available as part of the SQL Server stack. Therefore, we now have SSAS which is a component of SQL Server, and Azure AS which is now a separate cloud-based offering. The main difference is in where the model is deployed; the development experience is exactly the same. Prior to the release of Azure AS (PaaS), the only way to run Analysis Services in Azure was within a virtual machine (IaaS). If you're searching for information online, be a little careful & watch the dates-you will easily run into older articles which are talking about running SSAS in a VM rather than this PaaS service. The good news is that nearly all of the information will still be relevant though since the development experience remains in SQL Server Data Tools; the primary difference is in deployment.
There are two modes to an Analysis Services instance: Tabular and Multidimensional.
- Tabular is the newer in-memory data structure, based on DAX (Data Analysis eXpressions). Generally speaking, Tabular has an easier entry point though there is *definitely* a learning curve to DAX if you go beyond the simple stuff.
- Multidimensional is traditional OLAP so it's been around a lot longer, has a few more advanced features, and is based on MDX (MultiDimensional eXpressions). Multidimensional models are less 'forgiving' than Tabular models with respect to certain design characteristics (such as classifying facts and dimensions).
The rule of thumb most BI folks follow these days is to look at using a Tabular model unless you find you need one of the features that Multidimensional provides than isn't in Tabular yet. For this public preview of Azure AS, Tabular is the only mode supported initially. The product team has stated that Multidimensional will be considered for a future release, based on customer demand.
Regardless if you use Tabular or Multidimensional, your data is handled one of two ways:
- It can be imported into the Analysis Services in-memory model, which is also sometimes called cached mode. In this mode, Analysis Services holds a copy of the data and serves up the data from user queries. An in-memory model provides an excellent user experience assuming that enough memory is provided, and the design is sound. The data contained in an in-memory model needs to be refreshed on a schedule, so there's always some data latency.
- The other option is to utilize DirectQuery mode. In this mode, the queries are passed onto the underlying data source so Analysis Services really is metadata only. To get optimal performance with DirectQuery mode, the data source needs to be tuned for performance of user queries which is sometimes a challenge. The appeal of DirectQuery mode is access to real-time data, and the omission of needing to populate another dataset in Analysis Services.
Analysis Services development is usually handled by BI/Analytics/IT professionals within SQL Server Data Tools in Visual Studio, and it is typically under source control such as TFS or GitHub. No changes to the development experience occur as part of the introduction of Azure AS. This is a good thing-but it's important to be aware that development of a semantic model does take some time. It's fast and easy to create an Azure AS instance in Azure, and it's fast and easy to deploy the model, but development of the model itself does take time and know-how. The good news is there's tons of resources available to learn development techniques, such as dimensional modeling which is optimal for reporting.
Analysis Services is considered an enterprise-level data modeling tool. Ideally it exposes a large amount of your corporate data to business users. The pricing of Azure AS reflects that it is an enterprise-level tool (you can see pricing in the Azure portal when you provision the service).
Benefits of a Semantic Layer
According to b-eye-network: "A semantic layer is a business representation of corporate data that helps end users access data using common business terms."
A semantic layer sits between the original database and a reporting tool in order to assist business users with ease of reporting. It becomes the main entry point for data access for most business users when they are creating reports, dashboards, or running ad hoc queries.
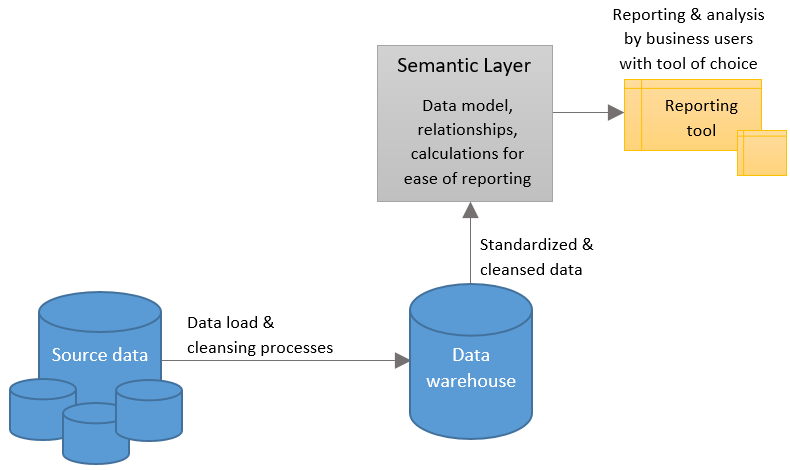
Traditionally, we've built a semantic layer on top of a traditional data warehouse. That's certainly not a requirement, though certainly still a very valid and common design pattern. In Part 2 of this post we'll talk about some variations on that theme to accommodate a modern data warehouse platform.
Though exposing reporting to users via a semantic layer is not an absolute "must" in today's world of options, it facilitates reporting for things such as:
- Data pre-integrated for users (ex: Salesforce data, invoice data, A/R data, and inventory data are all integrated for the end user to consume)
- No joins or relationships for users to worry (because they've all been handled in the data model)
- Columns have all been renamed into business user-friendly names (ex: Invoice Amount instead of INVAMT)
- Business business logic and calculations have been centralized in the data model (which reduces risk of recalculations being done incorrectly)
- Time-oriented calculations are included which are really powerful (ex: Sales Increase Year Over Year; Sales Year-To-Date; % of Change Since Prior Quarter)
- Aggregation behavior has been set so reporting tools respond correctly (ex: sales $ sum up, but something like a customer number or invoice does not try to aggregate)
- Formatting has been specified so reporting tools handle it by default (ex: sales displays with the $ sign whereas units display with commas and no pennies)
- Data security is incorporated (ex: standard row-level security, and/or exposing certain sensitive measurements to only authorized users)
In summary, a semantic layer is all about the convenience of business users so they can focus on getting the answer they need. It facilitates self-service reporting by providing a cleansed, understandable, trustworthy environment. A semantic layer can often support self-service analysis for 80% of a user base. After all, most functional users want to get the information quickly and then get on with their day. A semantic layer can also help the other 20% of users that have additional needs as well--though in all fairness, those hard core data analysts and data scientist types often prefer to go after the original source data, though there's certainly still value in them acquiring some of their data from the semantic layer as well. After all, why reinvent the wheel if the investment has been made?
So, even though we have tons of options these days for information delivery, and a single semantic layer for an entire organization isn't a silver bullet, I firmly believe that a semantic layer is certainly still a great tool in the toolbox.
Next up is Part 2: Use Cases for Azure Analysis Services
Finding More Info
Azure Documentation - What is Azure Analysis Services?
Feedback to the Product Team - Feedback on Azure AS
Channel 9 Videos: Azure AS Videos