How Often are Thumbnail Images Refreshed in the Power Pivot Gallery?

Overview:  A brief discussion of how and when the thumbnail preview images in a Power Pivot Gallery in SharePoint get refreshed.

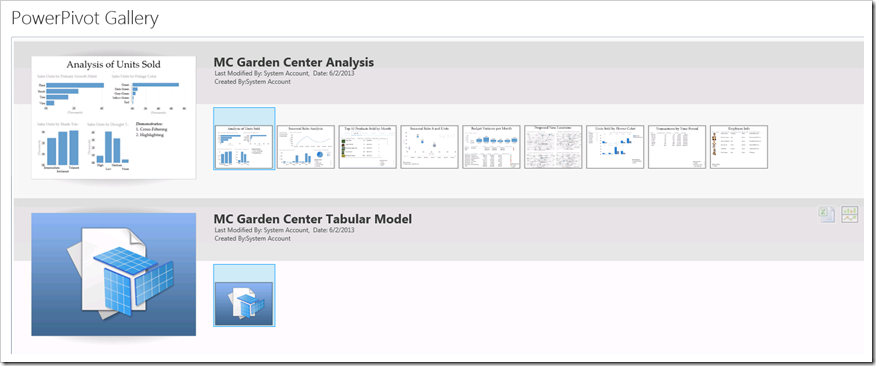
The Power Pivot Gallery is a specialized document library in SharePoint which utilizes Silverlight to render preview images of the report.  These previews are very helpful for users to quickly see if they have the correct report selected before executing it.

image

Ways to Refresh Thumbnail Images

Originally I had thought there would be a timer job which refreshes the thumbnails at a regular interval.  However, that is not the case.  There are 3 ways I’ve found to get thumbnails refreshed:

1.  Upload a new workbook.  The act of uploading a new workbook causes an event handler which will populate the thumbnail image for that workbook.

2.  Modify a workbook. The act of saving an existing workbook causes an event handler which will update the thumbnail image for that workbook.  Even if all you do is Edit Properties and then Save, that’s enough.

3.  Manually execute GallerySnapshot.exe.  This is a Windows service that runs on the app server where Excel Services is installed.  This exe gets called automatically when a file in the Power Pivot Gallery has been added or changed (an itemAdded or itemUpdated event, respectively, as mentioned in #1 and #2 above).  To run it manually, refer to this information:  http://blogs.msdn.com/b/mtn/archive/2010/10/15/how-to-manually-refresh-powerpivot-gallery-thumbnails.aspx.  Note that this service was called GetSnapshot.exe in SharePoint 2010, and has been renamed to GallerySnapshot.exe in SharePoint 2013.  The SharePoint 2013 GallerySnapshot.exe can be found at:  C:\Program Files\Common Files\Microsoft Shared\Web Server Extensions\15\BIN.

The takeaway:  Since the thumbnails only get regenerated in the above circumstances (and not at a regular interval), the preview images shouldn’t be thought of as something that is intended to coincide exactly with data updates.

Finding More Information

Technet – Refresh a Thumbnail Images

MSDN – Refreshing Power Pivot Gallery Thumbnails

Power Pivot Geek – General Problems with Gallery Snapshots Not Being Taken


Why “Power BI” is a Big Deal

***Note this post applies to Power BI for Office 365 (deprecated as of 12/31/2015). Though some concepts remain the same or similar, all details are not necessarily applicable to the new Power BI V2 service.***

A preview of Power BI will be available later this summer.  Here’s a recap of what I’ve learned so far + why I think this is a very big deal for the world of Microsoft Business Intelligence.

Excel is Primary Tool for Self-Service BI

There are four components to Power BI, and all are delivered via Excel.  Microsoft is capitalizing on the fact that a huge percentage of business users are most comfortable in an Excel environment.  Historically a large portion of Microsoft BI was developed with SQL Server and SharePoint tools – i.e., software predominantly available to IT and BI professionals.

The newest Excel capabilities lower the entry point of BI to anyone who has Excel and an interest in working with data.  SQL Server and SharePoint will continue to be my professional-level tools of choice for creating and delivering Corporate BI solutions.  Meanwhile Excel has emerged as the primary mechanism for creation and delivery of Self-Service BI solutions.  This continues to build upon the Personal BI > Team BI > Corporate BI framework promoted by Microsoft using a combination of Microsoft Office that’s installed on the desktop, Office 365 in the cloud, SQL Server and SharePoint.

Four Components to Power BI

Two of the Power BI components are for data preparation:  Power Pivot and Power Query.  The other two are for data visualization:  Power View and Power Map. 

  • Power Pivot.  Imports and integrates data from various sources for the purpose of creating an in-memory data model.  This allows a functional user to combine various data sources which improves its value – classic examples here are the addition of weather data or demographics data to corporate sales data.  The Power Pivot data model also supports calculations, derived fields, aggregates, hierarchies and key performance indicators.  The ability to create a data model with a relatively low learning curve is a very big deal for data analysts, particularly for one-time analysis type of situations.  It can also be helpful to IT and BI folks for prototyping.
  • Power Query.  Formerly Codename Data Explorer, this tool will be able to search for data (just like a web search experience) online or within your corporate data sources.  The selected data set is immediately imported into an Excel table – this search feature alone is a game-changer.  Some of the native data connectivity it offers are truly distinctive and make data access far easier than it’s been in the past.  It also allows you to do things like merge data, rename columns, replace values and other data modifications in a step-by-step process.  A very big deal here is that the step-by-step data cleansing and shaping process is savable and therefore repeatable.  You can also view the state of the data before and after each step.  Optionally, you can bring the data into your Power Pivot model to continue working with the data even further.
  • Power View.  Power View is an interactive data visualization tool.  It does certain things like highlighting and cross-filtering really well with very little learning curve.  Working with data in Power View bears similarities to working with Excel Pivot Tables as well as to PowerPoint.  In addition to charts, graphs, and table data, Power View also supports maps which pan and zoom via integration with Bing Maps.  The naturally interactive behavior of Power View is what makes it a very big deal.
  • Power Map.  Formerly Codename GeoFlow, Power Map is a 3D mapping tool.  What makes it unique is the ability to save scenes and play them over time in a tour.

Cloud-Based Self-Service BI

Power BI will be delivered in Office 365 (which actually uses SharePoint Online).  Although the preview that starts later this summer will use Office 365, all 4 Power BI tools are available to use as Excel add-ins now (some functionality is not fully supported within on-premises SharePoint).  Considering Microsoft has a cloud-first strategy, it’s not a big surprise that the initial preview will be with Office 365.  It’s unclear currently if all Power BI functionality will be available to on-premises SharePoint sites following the initial cloud-based rollout.  I hope so.

This focus on the cloud is a big deal, especially for small and medium-sized businesses.  It can also be a good thing for business units that need self-service capabilities but don’t have IT support or resources to fire up the required infrastructure.  Even large corporate environments can find some benefits to augmenting their on-premises BI environment with the cloud – especially if they want to upgrade to newer versions in the cloud faster than they can upgrade on-premise versions (i.e., a company-wide upgrade to Office 2013 can be a big task).  Creating the SharePoint and SQL Server server infrastructure to support Excel Services, PowerPivot for SharePoint, Reporting Services, and Analysis Services is not an easy task.  Not having to invest so much time, effort, and cost into setting up this infrastructure will be welcomed by many organizations.  However, there are certainly some obstacles which prevent some companies from using Excel in Office 365 even if they wanted to.  It will be interesting to see to what extent companies embrace the cloud, or utilize a hybrid approach to on-premise and cloud BI.

Mobile Support

Quite obviously mobile support is a big deal … Microsoft has announced native mobile applications for Windows 8, Windows RT, and the iPad.  HTML5 will be used for browser-based mobile delivery on other types of devices.  The way I understand it, to see a report on a mobile device it’ll need to be published to a Power BI workspace in O365, and in the properties of the report you’d set it as a “Mobile Favorite.”  Translation:  companies with Excel and Power View in SharePoint now won’t get to take advantage of this mobile functionality right away.

Windows-Live-Writer-Why-Power-BI-is-a-Big-Deal_F05D-

     Source for Image:  Power BI Demo by Amir Netz available here:  https://www.youtube.com/watch?v=Jsa-5LGx_IY

My understanding is Silverlight won’t be immediately removed from the stand-alone Power View application in or the SharePoint PowerPivot Gallery, but I’m guessing that’ll come in time.

Data Search and Refresh

Office 365 will utilize collaborative BI workspaces optimized for BI functionality.  Users will be able to publish Excel workbooks to workspaces and securely share them with coworkers.  Reusable data connections can be published, and data refreshes can be handled on-demand or on a schedule.  Data refreshes can access corporate data on-premises as well as data online (with proper security credentials of course).  Being able to search and access your enterprise data is a very big deal (this sounds like something the IT folks will need to facilitate for self-service users to take advantage of).

Queries created from Power Query will be able to be searched and shared among users.  This sharing of queries is a big deal – anything that promotes reusability & consistency gets a big thumbs-up from me.

image
image
Windows-Live-Writer-Why-Power-BI-is-a-Big-Deal_F05D-

     Source for Both Images:  Power BI Demo by Amir Netz available here:  https://www.youtube.com/watch?v=Jsa-5LGx_IY

Tracking of Data Usage

A new feature I’m particularly excited about is the tracking of data usage.  Stats re: how often data sources & reports are accessed will be readily accessible to those who build models and reports.  This is currently a feature of Central Administration in SharePoint, or by querying the Power Pivot Management Data tabular model if you don’t want to grant Central Admin access to a non-SharePoint administrator.  I look forward to seeing how easily this information can be reviewed for one report, one data source, or for many reports and data sources.

Easy access to these stats is a big deal because if you see usage going way up, then there’s an awareness that this particular report or data source has become critical.  This might mean a data refresh failure is of greater urgency, or data quality is of even greater concern.  Let’s say it’s a Power Pivot model that’s become critical and it continues to grow larger and more complex – that might be a perfect scenario to upgrade the self-service Power Pivot model to a corporate Tabular model in Analysis Services.

Data Stewardship

Lastly, a big component of Power BI is the concept of data stewardship.  There’s not a lot of public information about this available yet.  This will include management of security, data refresh permissions, tracking data usage, as well as a few other things that we’ll learn more about when the preview is available.  I’ve typically thought of data stewardship with the mindset of data quality and/or master data management, so I’m extremely interested in seeing the direction Microsoft will take with this.  Regardless of how you define it, data stewardship is the kind of thing that can really make a self-service BI initiative more successful and/or less problematic – so I think this concept of data stewardship will end up being a very big deal.

Finding More Information

Register for the “Microsoft Power BI for Office 365” preview – Office Site

Chris Webb’s Blog – Some Thoughts About Power BI

Jen Underwood’s Blog – Microsoft Office 365 Cloud Power BI

Jason Thomas’ Blog – Power BI for Office 365

Jamie Thomson’s Blog – Thoughts on Power BI for Office 365

John White’s Blog – Power BI-What Is It?

Displaying a Power View Report on a SharePoint Page

Overview: How to structure the URL for displaying a Power View report on a SharePoint 2013 page, including what parameters to pass in the URL.  This entry presumes the reader is familiar with SharePoint basics, including how to create a site page.

Ways to Render Power View Reports Within SharePoint

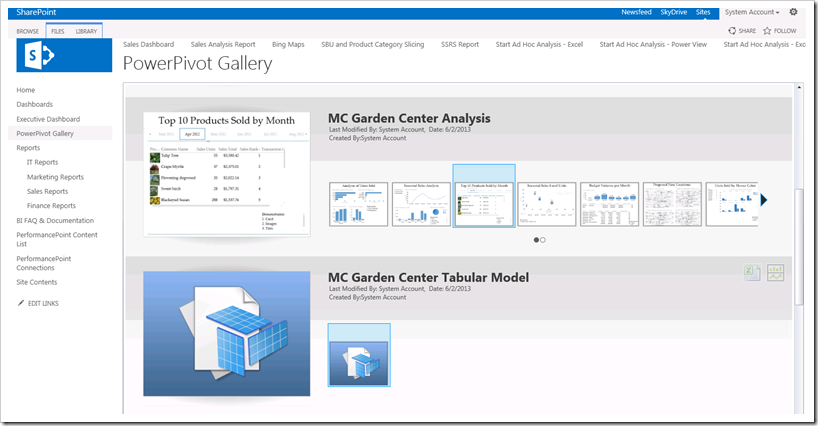
Because of its support for previewing the report via thumbnail images, the PowerPivot Gallery is a very common way of storing & accessing Power View reports:
     image

However, perhaps you really would like to display a Power View report on a SharePoint page, possibly as part of a dashboard that combines various types of reports. 

Ways of rendering Power View reports in SharePoint 2013 include:

  • Via the PowerPivot Gallery (as shown above)
  • Via a regular document library (note: it won’t have the thumbnail previews like the PowerPivot Gallery does due to its integration with Silverlight)
  • Within a Page Viewer Web Part
  • Within a Silverlight Web Part (note: since word on the street is that Silverlight has a finite lifespan, this might not be your first choice)
  • Embedded within a PerformancePoint Dashboard (via the web page report type)
  • Within an Excel Web Access Web Part (applicable to Power View reports created with Excel 2013)

Note that even though Power View is part of the Reporting Services family, you cannot use the SQL Server Reporting Services Report Viewer web part – it can only display RDL files (generated from Reporting Services or Report Builder).  It cannot currently display RDLX files (generated from Power View for SharePoint).

The remainder if this blog entry focuses on the Page Viewer Web Part.

Steps to Use the Page Viewer Web Part

First, you’ll want to create a Site Page in SharePoint if you don’t have one already.  Once you are in Edit mode for your page, go to the Insert ribbon.  From there, choose Web Part on the ribbon.  Browse through the Media and Content category to find the Page Viewer.  Make sure you’ve clicked within the section you want the Power View report to be in, then click Add.

     image

Then you’ll want to click the “open the tool pane” hyperlink to access its properties.

     image

There are four sections of properties – only the first two sections are really important for displaying our Power View report.

Page Viewer Properties

  • Web Page radio button – Leave this selected.
  • Link – Specify the URL which will look something like this (below is more detail about constructing the URL):

    /_layouts/15/ReportServer/AdHocReportDesigner.aspx?RelativeReportUrl=%2fPowerPivot%20Gallery%2fMC%20Garden%20Center%20Analysis.rdlx&ViewMode=Presentation&ReportSection=ReportSection2&Fit=True&PreviewBar=False

     image

Hint:  the only piece that is absolutely positively required is the URL as shown in the above Page Viewer section…but if you skip the rest of the settings, you’ll end up with awfully ugly output that isn’t readable at all:

     image

Since we want it to be pretty, we’ll carry on with the rest of the properties…

Appearance Properties

  • Title – Change this from Page Viewer if you intend for the title to be shown (often the report itself will have a title, so often you can omit titling the web part itself too).
  • Height – Here’s where you are going to need to experiment somewhat.  The “Adjust height to fit zone” default doesn’t really do the trick from what I have seen.
  • Width – Chances are you can leave this as-is so it adjusts to fit the zone.
  • Chrome State – You’ll want to leave this as normal to ensure the report itself displays.
  • Chrome Type – Set this based on how you want to see the page.  If you are skipping the Title (i.e., if the report itself has a title), you might set the Chrome Type to have a border only, or perhaps none. 

     image

Layout Properties

Nothing required to be changed here.

     image

Advanced Properties

Nothing required to be changed here unless you’d like.

     image

Constructing the URL for Display of the Power View Report

Now let’s take a step back and look at how the URL is constructed.  It uses the AdHocReportDesigner.aspx page, as well as several parameters, including:

  • RelativeReportURL – Points to the RDLX file
  • ViewMode – Presentation or Edit
  • ReportSection – Reference to which view will be displayed initially
  • Fit – True/False setting which allows for resizing
  • PreviewBar – True/False setting which controls if the menu across the top is shown or not

Here’s how the URL can be broken down into its components:

     image

How the Power View Report Looks In the Page Viewer Web Part

How it ends up looking in SharePoint depends a lot on the parameter values you pass in via the URL, as well as the Height property you set in the properties.  Note that the pagination controls at the bottom left & bottom right are still active which is nice.  This means that even if you set the URL to jump to view 6, for instance, the end user can still paginate through and see all the views (i.e., pages) contained within the single Power View report.

Here’s an example where the Report Section is set to launch page 2 immediately, the View Mode is set to Presentation, and the Preview Bar is set to False within the URL string:

     image

Here’s another example of the same report, except the Preview Bar is set to True within the URL string:

     image

And here’s one more example of the same report, this time with the View Mode set to Edit:

     image

Prerequisites

SharePoint needs to be on-premises (as opposed to SharePoint Online) and configured in “SharePoint View Mode” rather than “Office Web Apps Server Mode.”  I’m guessing this is a temporary limitation around OWA support.

The Power View report needs to be created in SharePoint, as opposed to within an Excel 2013 file.  This requires the Reporting Services Add-In for SharePoint.

The browser must support the <iframe> element, which basically nests browsing context separately from the entire page.  All major modern browsers support iframes.

Finding More Information

Dan English Blog – Presenting Power View Reports to Users

Dan English Blog – URL Actions within Reporting Services Power View (RTM)

Himanshu Gupta Blog – Integrate Power View with SharePoint Using Web Parts

Office - Power View in Excel  in SharePoint Server or SharePoint Online in Office 365


Behavior of Power View in Excel 2013 within SharePoint 2013

Overview:  A quick post about what to expect when integrating Power View worksheets embedded in Excel 2013 into a SharePoint 2013 site.  Note that this behavior is a temporary situation…I’m guessing the SharePoint team at Microsoft is planning to getting full integration with Power View working.  Should just be a matter of time. 

Versions Applicable:  This behavior I’ve observed is applicable to Excel 2013 (i.e., the only version of Excel that supports embedding Power View worksheets) with SharePoint 2013.

First, let’s take a peek at the original Excel file.  This first screen shot is from the Excel application, before it’s been uploaded to SharePoint.  Note that there are 5 worksheets, 2 of which are Power View.

     image   

Next, let’s look at how the Excel file appears in SharePoint.  This next screen shot is from a PowerPivot Gallery in SharePoint 2013.  Note the display of an icon at the bottom right of each thumbnail preview – the tooltip for these reads “The document contains more items than can be displayed by the PowerPivot Gallery.” 

     image

Next we’ll click on the Excel file to render it interactively using Excel Services.  Note that the Power View worksheets do appear along the bottom.  Note also that the interactivity functionality is present.  That’s the good news!  (Keep reading for the bad news…)

     image

Next let’s download the workbook from SharePoint by doing a File > Save As > Download.  We are then presented with a dialog box stating “Features that we can’t show in the browser and interactive reports will be removed from the downloaded copy.  Continue with the download?”   Say Yes.

     image

     image

After selecting a location for the downloaded file, open it in Excel.  Guess what we see in the downloaded version of the file?  You got it…only 3 worksheets.  The 2 Power View worksheets were not retained because they’re not yet fully supported.

     image

The moral of the story here?  Until we have a release that fully supports Power View embedded within Excel, hang onto your original Excel file!