This is part 2 of a discussion about a new service in Microsoft Azure: Azure Analysis Services. Azure AS is a Platform-as-a-Service (PaaS) offering which is in public preview mode (as of November 2016).
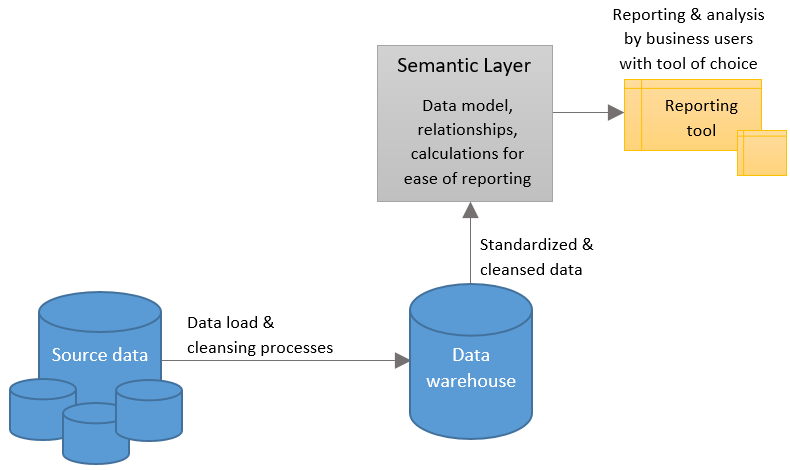
Part 1: Why a Semantic Layer Like Azure Analysis Services is Relevant
Part 2: Use Cases for Azure Analysis Services {you are here}
Part 3: Where Azure Analysis Services Fits Into BI & Analytics Architecture
Because Azure AS is a cloud service, it has several meaningful benefits we've come to associated with this type of PaaS service:
- Ability to scale up or down to increase performance when the demand is there (yet not pay for that level of performance when it's not required)
- Ability to pause to save money if no queries are issued during a particular period of time (such as overnight on Dev/Test databases)
- No need to provision hardware, handle upgrades nor patching
- Inherent redundancy of the data
Note: at this early time of the public preview, not every feature mentioned in this post is available just yet, but they are coming.
Azure SSAS May Be Beneficial For...
Upsizing Data Size from Power BI
If you import the data into a Power BI data model (vs. issuing queries via DirectQuery mode), the data imported is currently limited to 1GB of data if you want to upload the file to the Power BI Service. This 1GB is after it's been compressed into its in-memory columnar format. The columnar compression is very efficient, so it can contain quite a bit of data, but 1GB certainly doesn't represent enterprise level data models (again, I'm referring to imported data not DirectQuery scenarios). Upsizing to Analysis Services changes all that since it can handle larger data volumes imported to the in-memory data model.
Faster Data Refresh Schedules than Power BI
Currently you can set a Power BI dataset (which has been imported) to refresh up to 4 times per day. If your data latency requirements dictate fresher data than that, then Analysis Services can be scheduled more frequently. (Just like the previous item, this refers to imported data and not DirectQuery models.)
Varying Levels of Peak Workloads
Let's say during month-end close the reporting activity spikes much higher than the rest of a typical month. In this situation, it's a shame to provision hardware that is underutilized a large percentage of the rest of the month. This type of scenario makes a scalable PaaS service more attractive than dedicated hardware. Do note that currently Azure SSAS scales compute, known as the QPU or Query Processing Unit level, along with max data size (which is different than some other Azure services which decouple those two).
User Activity Occurs During Fixed Hours Only
We will be able to pause the Azure AS service in order to save charges. If you're a regional company with users who don't need to query the system from, say 10pm to 7am, you'll be able to pause the service programmatically if you choose.
Cloud or Hybrid Fits Your Strategic IT Direction
If you're purposely attempting to reduce the overhead of running a data center, then more and more service offerings like this one may be a fit. To the extent you're using multiple services such as Azure SQL Data Warehouse and/or Azure SQL Database, I'm hoping we're going to see some performance benefits (assuming you've selected Azure locations in close proximity to each other for the related services that pass data around).
You Are Short on Performance Tuning Expertise
I tend to get a little preachy that running workloads in the cloud does *not* mean your DBA can retire. However, it is certainly the case that there's less administrative oversight with cloud services. With this Azure AS PaaS service, rather than tuning your server specs, instead you would change the scale level for your instance in Azure - certainly a lot easier because there's a way fewer "knobs" to adjust. Having said that, there's still *lots* of things to pay attention to: performance of queries from the original source (if your data refresh window is small, or if you are using DirectQuery mode), and also good design patterns are always *incredibly* important in order to achieve optimal performance from an Analysis Services model.
Getting New Features Fastest
We're going to be seeing new features hit Azure Analysis Services faster than SQL Server Analysis Services. Using the AAS cloud service, versus the SSAS service which is part of the SQL Server box product, offers that if getting the latest and greatest quickly appeals to you.
Next up is Part 3: Where Azure Analysis Services Fits Into BI & Analytics Architecture
Finding More Information
Kasper de Jonge's blog: Analysis Services in Azure, When and Why (I had 95% of this post written before Kasper published his, so I decided to publish mine anyway even though they're fairly similar.)
Azure Documentation - What is Azure Analysis Services?
Feedback to the Product Team - Feedback on Azure AS
Channel 9 Videos: Azure AS Videos